
LISA: LLM-Inferred Semantic Annotation

R package

Analysis and semantic annotation of gene set enrichment results

lisaR takes differential expression results, runs gene set enrichment analysis (GSEA) and groups the results into biological categories. It generates a portable report where you can inspect the gene sets and genes associated with each category.

What LISA means

LISA stands for LLM-Inferred Semantic Annotation. LISA dictionaries were built with the help of large language models (LLMs). When analysing your data, lisaR applies these assignments on your computer. No data is sent to any cloud-hosted LLM.

How the LISA dictionaries were built
Open the full workflow

01 · How lisaR works

Run gene set enrichment analysis and explore the results by biological category.

Differential expression analysis is performed before using lisaR. Specify which groups you are comparing and which group corresponds to positive ranking values so that you can interpret the direction of enrichment.

Analysis with lisaR
Open the full workflow
  1. Differential expression results

    Provide a gene ranking table derived from your differential expression results.

  2. Gene set enrichment

    Run GSEA using the selected collections. You can inspect the statistics for each gene set and its leading-edge genes.

  3. Semantic annotation

    LISA dictionaries assign gene sets to biological categories and group these into broader supercategories to help interpret the results.

  4. Portable report

    Explore each category and inspect its gene sets and associated genes. You can share the report folder and open it on another computer.

02 · Explore results

Explore an example result: Riaz et al.

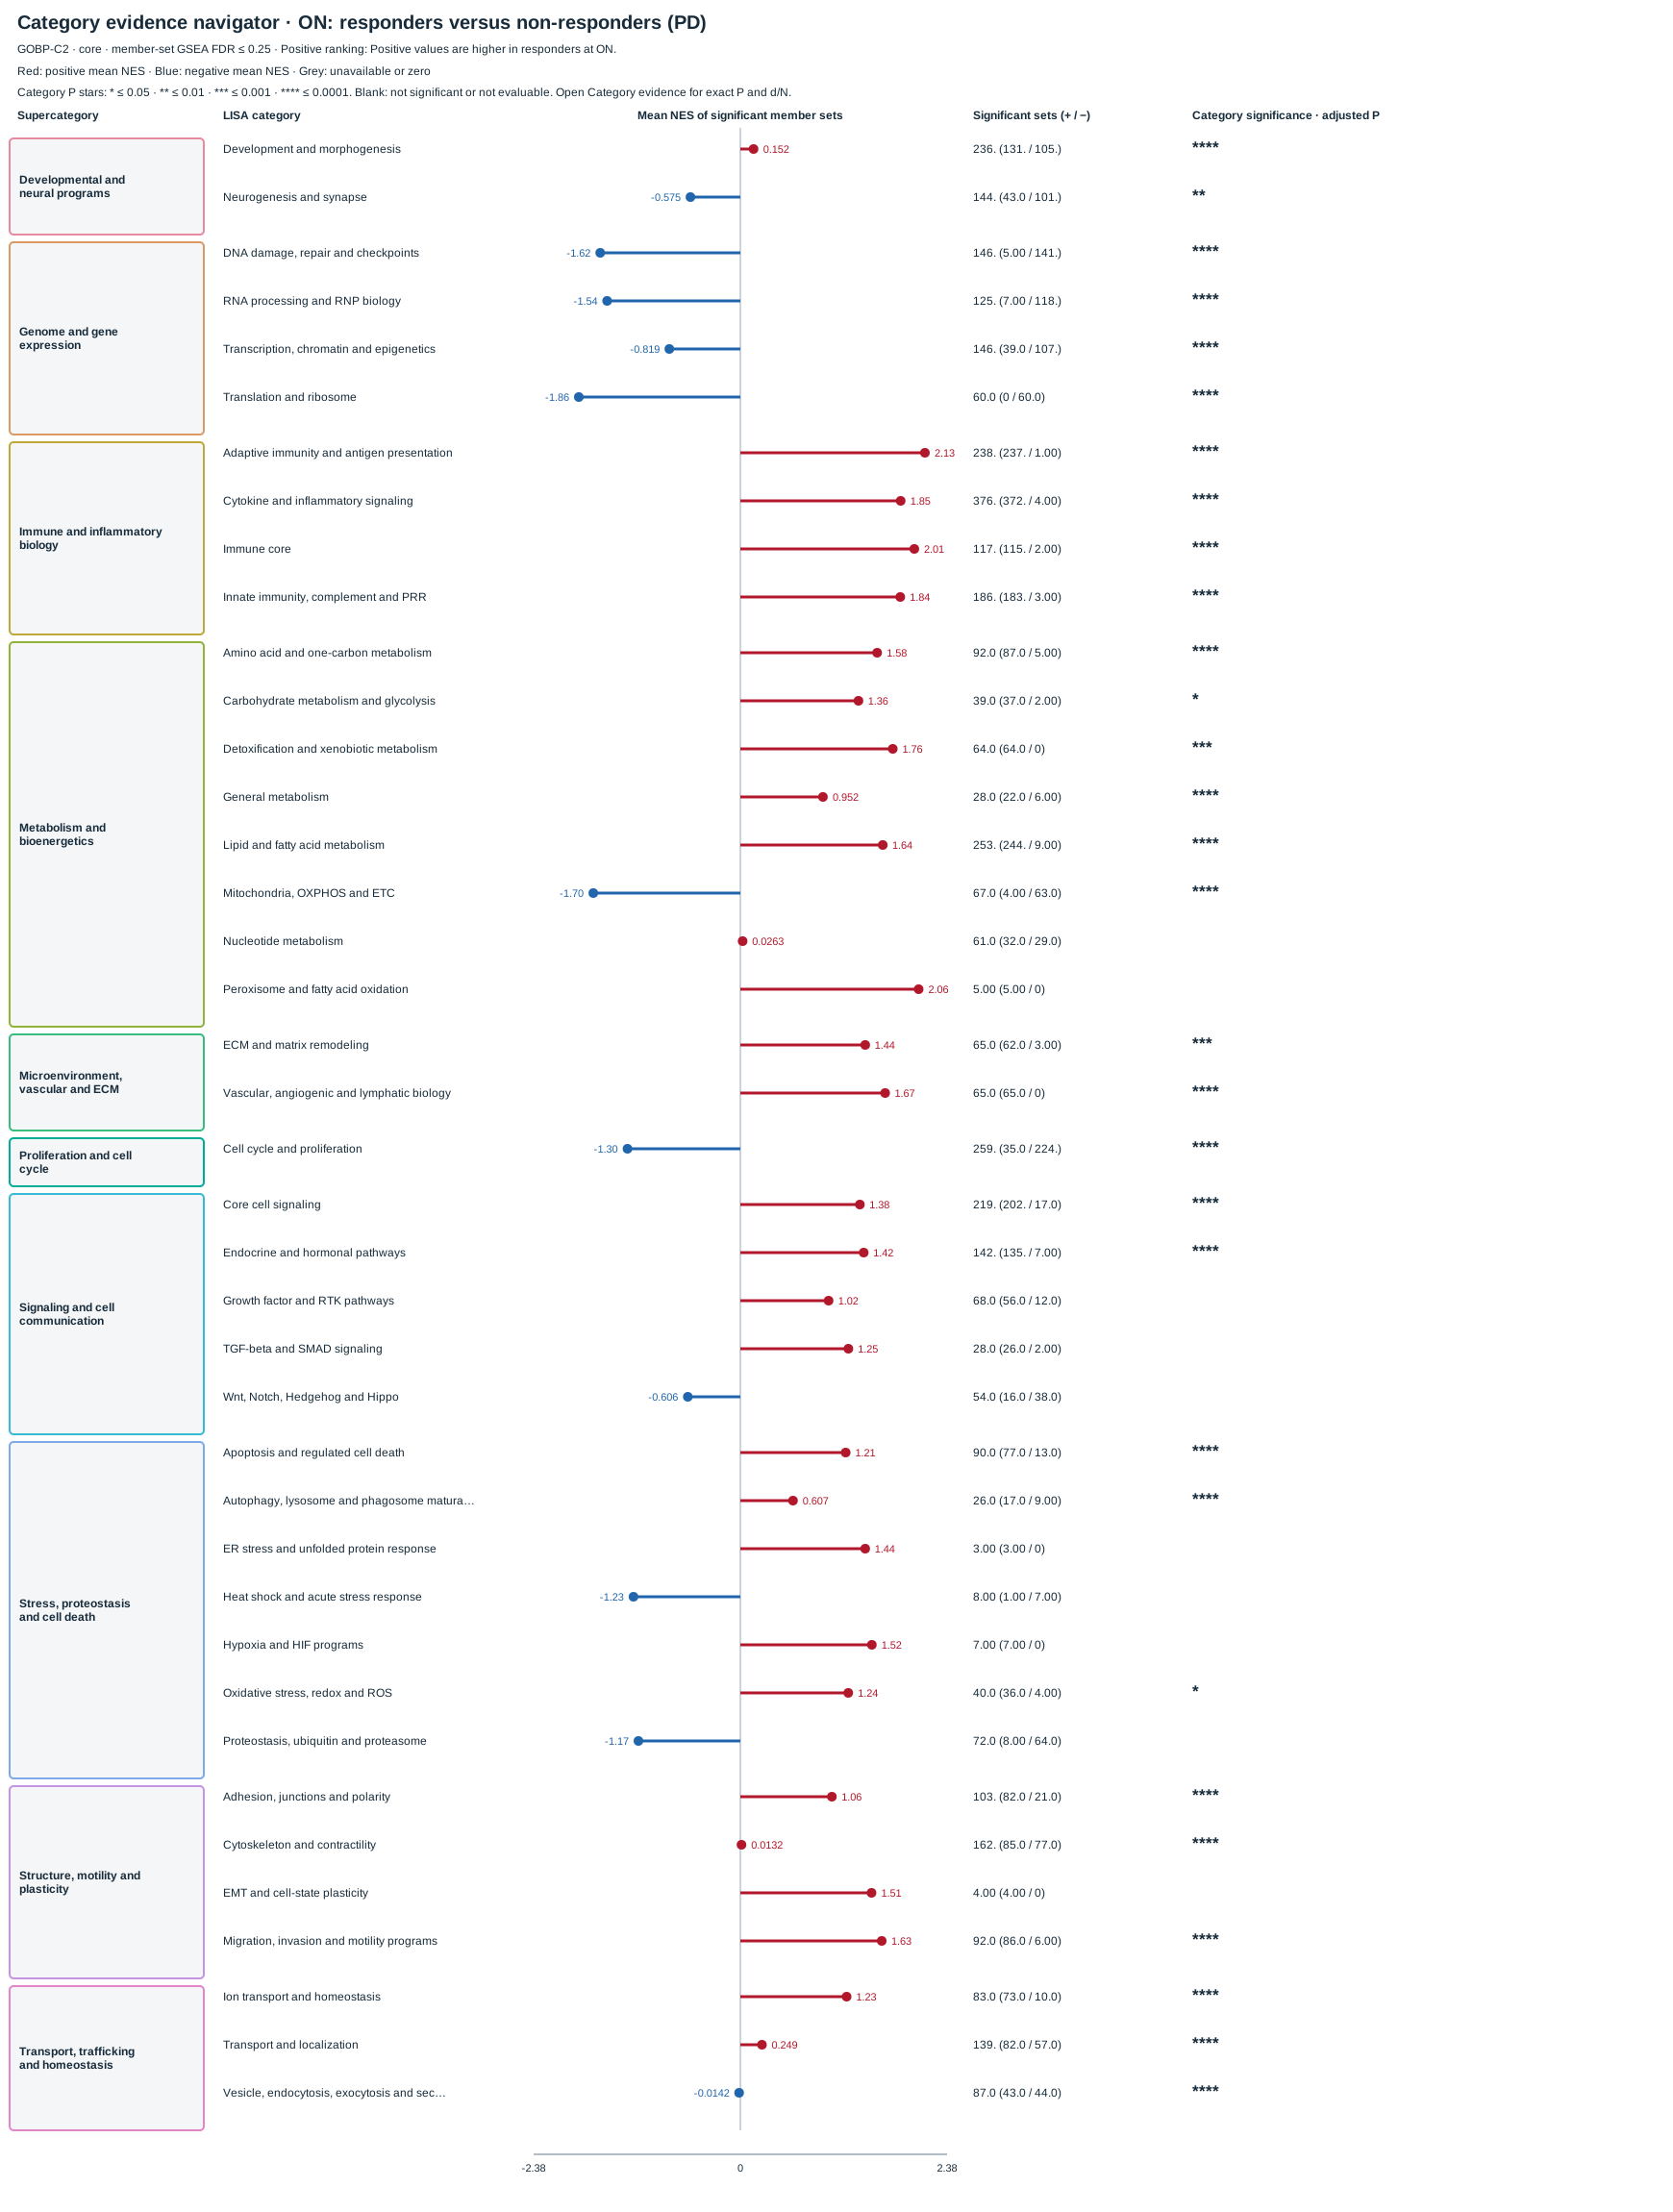
Click a LISA category name or point to open its evidence page, where you can inspect the gene sets and genes contributing to the result.

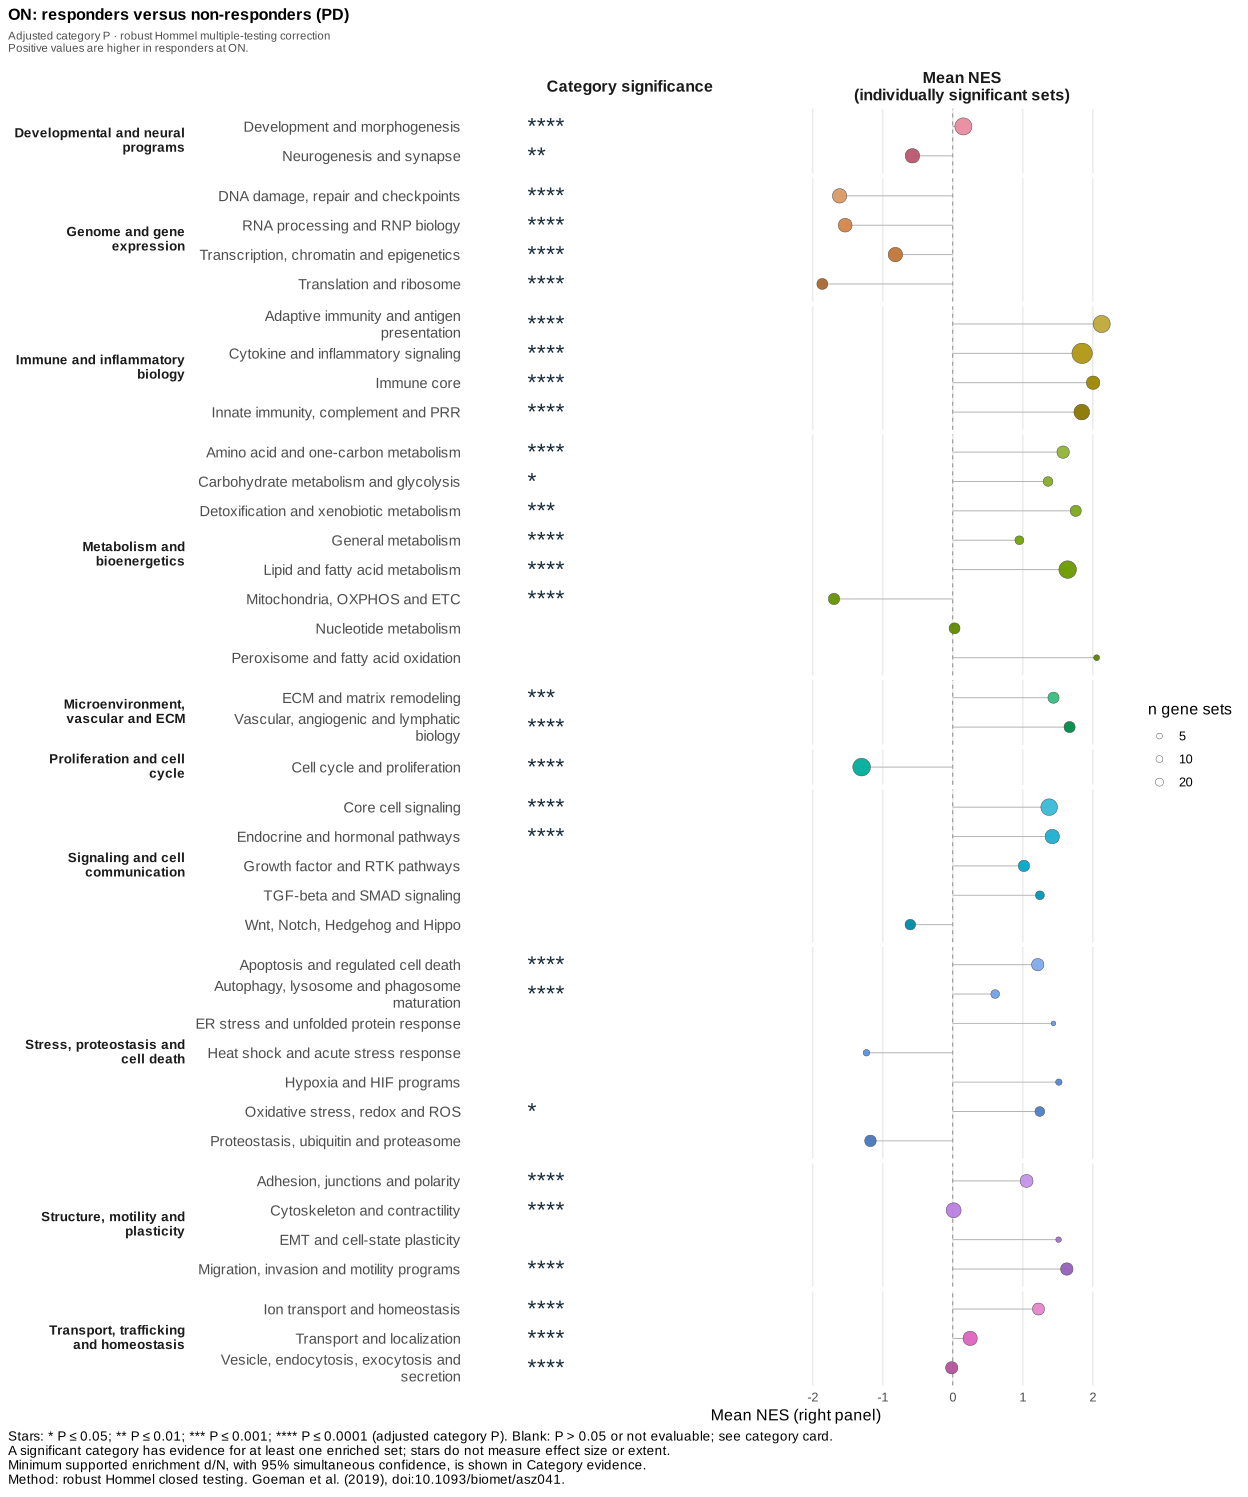
On-treatment nivolumab results: responders (CR/PR) minus progressive disease (PD). Member-set GSEA FDR ≤ 0.25. Stars report Hommel-adjusted category P; the evidence page gives the exact value and minimum supported enrichment (d/N). Mean NES is descriptive, not a category significance test. The original chart and evidence pages are in English.

The chart shows all 40 GOBP-C2 categories. Scroll to see them all; on smaller screens you can also scroll horizontally.

Category evidence navigator · ON: responders versus non-responders (PD) GOBP-C2 · core · member-set GSEA FDR ≤ 0.25 · Positive ranking: Positive values are higher in responders at ON. Each category label and point links to its category evidence. Stars show adjusted category P from robust Hommel multiple-testing correction; minimum support d/N is in Category evidence. Mean NES is descriptive, not a category significance test. Category evidence navigator · ON: responders versus non-responders (PD) GOBP-C2 · core · member-set GSEA FDR ≤ 0.25 · Positive ranking: Positive values are higher in responders at ON. Red: positive mean NES · Blue: negative mean NES · Grey: unavailable or zero Category P stars: * ≤ 0.05 · ** ≤ 0.01 · *** ≤ 0.001 · **** ≤ 0.0001. Blank: not significant or not evaluable. Open Category evidence for exact P and d/N. Supercategory LISA category Mean NES of significant member sets Significant sets (+ / −) Category significance · adjusted P Developmental and neural programs Genome and gene expression Immune and inflammatory biology Metabolism and bioenergetics Microenvironment, vascular and ECM Proliferation and cell cycle Signaling and cell communication Stress, proteostasis and cell death Structure, motility and plasticity Transport, trafficking and homeostasis Development and morphogenesis; DEVELOPMENT_MORPHOGENESIS; mean NES 0.152; 236. (131. / 105.). Open category evidence. Adjusted category P: 1.0143905644500296e-07; category significance: significant (****). Development and morphogenesis 236. (131. / 105.) **** 0.152 Neurogenesis and synapse; NEUROGENESIS_SYNAPSE; mean NES -0.575; 144. (43.0 / 101.). Open category evidence. Adjusted category P: 0.0014968386285306508; category significance: significant (**). Neurogenesis and synapse 144. (43.0 / 101.) ** -0.575 DNA damage, repair and checkpoints; DNA_DAMAGE_REPAIR_CHECKPOINTS; mean NES -1.62; 146. (5.00 / 141.). Open category evidence. Adjusted category P: 1.0900657313105607e-19; category significance: significant (****). DNA damage, repair and checkpoints 146. (5.00 / 141.) **** -1.62 RNA processing and RNP biology; RNA_PROCESSING_SPLICING_RNP; mean NES -1.54; 125. (7.00 / 118.). Open category evidence. Adjusted category P: 2.1266625781917534e-30; category significance: significant (****). RNA processing and RNP biology 125. (7.00 / 118.) **** -1.54 Transcription, chromatin and epigenetics; TRANSCRIPTION_CHROMATIN_EPIGENETICS; mean NES -0.819; 146. (39.0 / 107.). Open category evidence. Adjusted category P: 1.9330023069973103e-15; category significance: significant (****). Transcription, chromatin and epigenetics 146. (39.0 / 107.) **** -0.819 Translation and ribosome; TRANSLATION_RIBOSOME; mean NES -1.86; 60.0 (0 / 60.0). Open category evidence. Adjusted category P: 1.0007705585419746e-21; category significance: significant (****). Translation and ribosome 60.0 (0 / 60.0) **** -1.86 Adaptive immunity and antigen presentation; IMMUNE_ADAPTIVE_ANTIGEN_MHC; mean NES 2.13; 238. (237. / 1.00). Open category evidence. Adjusted category P: 2.9470610701944526e-70; category significance: significant (****). Adaptive immunity and antigen presentation 238. (237. / 1.00) **** 2.13 Cytokine and inflammatory signaling; IMMUNE_CYTOKINE_INFLAMMATORY; mean NES 1.85; 376. (372. / 4.00). Open category evidence. Adjusted category P: 6.8768563417266329e-25; category significance: significant (****). Cytokine and inflammatory signaling 376. (372. / 4.00) **** 1.85 Immune core; IMMUNE_CORE; mean NES 2.01; 117. (115. / 2.00). Open category evidence. Adjusted category P: 2.1125629923225436e-43; category significance: significant (****). Immune core 117. (115. / 2.00) **** 2.01 Innate immunity, complement and PRR; IMMUNE_INNATE_COMPLEMENT_PRR; mean NES 1.84; 186. (183. / 3.00). Open category evidence. Adjusted category P: 5.9128097511471677e-19; category significance: significant (****). Innate immunity, complement and PRR 186. (183. / 3.00) **** 1.84 Amino acid and one-carbon metabolism; METABOLISM_AA_ONECARBON; mean NES 1.58; 92.0 (87.0 / 5.00). Open category evidence. Adjusted category P: 4.1574237841078337e-08; category significance: significant (****). Amino acid and one-carbon metabolism 92.0 (87.0 / 5.00) **** 1.58 Carbohydrate metabolism and glycolysis; METABOLISM_CARBOHYDRATE_GLYCOLYSIS; mean NES 1.36; 39.0 (37.0 / 2.00). Open category evidence. Adjusted category P: 0.042834942702418936; category significance: significant (*). Carbohydrate metabolism and glycolysis 39.0 (37.0 / 2.00) * 1.36 Detoxification and xenobiotic metabolism; DETOX_XENOBIOTIC_METABOLISM; mean NES 1.76; 64.0 (64.0 / 0). Open category evidence. Adjusted category P: 0.00014281817184015714; category significance: significant (***). Detoxification and xenobiotic metabolism 64.0 (64.0 / 0) *** 1.76 General metabolism; METABOLISM_CORE; mean NES 0.952; 28.0 (22.0 / 6.00). Open category evidence. Adjusted category P: 2.1834347290517388e-16; category significance: significant (****). General metabolism 28.0 (22.0 / 6.00) **** 0.952 Lipid and fatty acid metabolism; METABOLISM_LIPID_FA; mean NES 1.64; 253. (244. / 9.00). Open category evidence. Adjusted category P: 1.650072204421804e-16; category significance: significant (****). Lipid and fatty acid metabolism 253. (244. / 9.00) **** 1.64 Mitochondria, OXPHOS and ETC; MITOCHONDRIA_OXPHOS_ETC; mean NES -1.70; 67.0 (4.00 / 63.0). Open category evidence. Adjusted category P: 1.1952682737019185e-11; category significance: significant (****). Mitochondria, OXPHOS and ETC 67.0 (4.00 / 63.0) **** -1.70 Nucleotide metabolism; METABOLISM_NUCLEOTIDE; mean NES 0.0263; 61.0 (32.0 / 29.0). Open category evidence. Adjusted category P: 0.15135796646694358; category significance: not significant. Nucleotide metabolism 61.0 (32.0 / 29.0) 0.0263 Peroxisome and fatty acid oxidation; PEROXISOME_FAO; mean NES 2.06; 5.00 (5.00 / 0). Open category evidence. Adjusted category P: 0.12151044841179942; category significance: not significant. Peroxisome and fatty acid oxidation 5.00 (5.00 / 0) 2.06 ECM and matrix remodeling; ECM_MATRIX_REMODELING; mean NES 1.44; 65.0 (62.0 / 3.00). Open category evidence. Adjusted category P: 0.0002683258511581743; category significance: significant (***). ECM and matrix remodeling 65.0 (62.0 / 3.00) *** 1.44 Vascular, angiogenic and lymphatic biology; VASCULAR_LYMPHATIC; mean NES 1.67; 65.0 (65.0 / 0). Open category evidence. Adjusted category P: 7.2593205548024705e-06; category significance: significant (****). Vascular, angiogenic and lymphatic biology 65.0 (65.0 / 0) **** 1.67 Cell cycle and proliferation; CELL_CYCLE_PROLIFERATION; mean NES -1.30; 259. (35.0 / 224.). Open category evidence. Adjusted category P: 1.1625288421673781e-21; category significance: significant (****). Cell cycle and proliferation 259. (35.0 / 224.) **** -1.30 Core cell signaling; SIGNALING_CORE; mean NES 1.38; 219. (202. / 17.0). Open category evidence. Adjusted category P: 1.438404934151987e-08; category significance: significant (****). Core cell signaling 219. (202. / 17.0) **** 1.38 Endocrine and hormonal pathways; ENDOCRINE_HORMONAL; mean NES 1.42; 142. (135. / 7.00). Open category evidence. Adjusted category P: 7.3657620587797871e-07; category significance: significant (****). Endocrine and hormonal pathways 142. (135. / 7.00) **** 1.42 Growth factor and RTK pathways; GROWTH_FACTOR_RTK; mean NES 1.02; 68.0 (56.0 / 12.0). Open category evidence. Adjusted category P: 0.30508269740971522; category significance: not significant. Growth factor and RTK pathways 68.0 (56.0 / 12.0) 1.02 TGF-beta and SMAD signaling; TGFB_SMAD; mean NES 1.25; 28.0 (26.0 / 2.00). Open category evidence. Adjusted category P: 1; category significance: not significant. TGF-beta and SMAD signaling 28.0 (26.0 / 2.00) 1.25 Wnt, Notch, Hedgehog and Hippo; WNT_NOTCH_HEDGEHOG_HIPPO; mean NES -0.606; 54.0 (16.0 / 38.0). Open category evidence. Adjusted category P: 1; category significance: not significant. Wnt, Notch, Hedgehog and Hippo 54.0 (16.0 / 38.0) -0.606 Apoptosis and regulated cell death; APOPTOSIS_CELL_DEATH; mean NES 1.21; 90.0 (77.0 / 13.0). Open category evidence. Adjusted category P: 1.2654608479565716e-07; category significance: significant (****). Apoptosis and regulated cell death 90.0 (77.0 / 13.0) **** 1.21 Autophagy, lysosome and phagosome maturation; AUTOPHAGY_LYSOSOME; mean NES 0.607; 26.0 (17.0 / 9.00). Open category evidence. Adjusted category P: 7.689198458053076e-17; category significance: significant (****). Autophagy, lysosome and phagosome matura… 26.0 (17.0 / 9.00) **** 0.607 ER stress and unfolded protein response; ER_STRESS_UPR; mean NES 1.44; 3.00 (3.00 / 0). Open category evidence. Adjusted category P: 1; category significance: not significant. ER stress and unfolded protein response 3.00 (3.00 / 0) 1.44 Heat shock and acute stress response; HEAT_SHOCK_STRESS_RESPONSE; mean NES -1.23; 8.00 (1.00 / 7.00). Open category evidence. Adjusted category P: 1; category significance: not significant. Heat shock and acute stress response 8.00 (1.00 / 7.00) -1.23 Hypoxia and HIF programs; HYPOXIA_HIF; mean NES 1.52; 7.00 (7.00 / 0). Open category evidence. Adjusted category P: 1; category significance: not significant. Hypoxia and HIF programs 7.00 (7.00 / 0) 1.52 Oxidative stress, redox and ROS; OXIDATIVE_STRESS_REDOX_ROS; mean NES 1.24; 40.0 (36.0 / 4.00). Open category evidence. Adjusted category P: 0.04501580988333273; category significance: significant (*). Oxidative stress, redox and ROS 40.0 (36.0 / 4.00) * 1.24 Proteostasis, ubiquitin and proteasome; PROTEOSTASIS_UBIQUITIN_PROTEASOME; mean NES -1.17; 72.0 (8.00 / 64.0). Open category evidence. Adjusted category P: 1; category significance: not significant. Proteostasis, ubiquitin and proteasome 72.0 (8.00 / 64.0) -1.17 Adhesion, junctions and polarity; ADHESION_JUNCTION_POLARITY; mean NES 1.06; 103. (82.0 / 21.0). Open category evidence. Adjusted category P: 2.1177674526913374e-35; category significance: significant (****). Adhesion, junctions and polarity 103. (82.0 / 21.0) **** 1.06 Cytoskeleton and contractility; CYTOSKELETON_CONTRACTILITY; mean NES 0.0132; 162. (85.0 / 77.0). Open category evidence. Adjusted category P: 2.8340290310217947e-13; category significance: significant (****). Cytoskeleton and contractility 162. (85.0 / 77.0) **** 0.0132 EMT and cell-state plasticity; EMT_PLASTICITY; mean NES 1.51; 4.00 (4.00 / 0). Open category evidence. Adjusted category P: 1; category significance: not significant. EMT and cell-state plasticity 4.00 (4.00 / 0) 1.51 Migration, invasion and motility programs; MIGRATION_INVASION; mean NES 1.63; 92.0 (86.0 / 6.00). Open category evidence. Adjusted category P: 1.9869491788234818e-18; category significance: significant (****). Migration, invasion and motility programs 92.0 (86.0 / 6.00) **** 1.63 Ion transport and homeostasis; ION_TRANSPORT_HOMEOSTASIS; mean NES 1.23; 83.0 (73.0 / 10.0). Open category evidence. Adjusted category P: 4.6805371929954743e-06; category significance: significant (****). Ion transport and homeostasis 83.0 (73.0 / 10.0) **** 1.23 Transport and localization; TRANSPORT_LOCALIZATION; mean NES 0.249; 139. (82.0 / 57.0). Open category evidence. Adjusted category P: 6.9500711492278733e-08; category significance: significant (****). Transport and localization 139. (82.0 / 57.0) **** 0.249 Vesicle, endocytosis, exocytosis and secretion; VESICLE_SECRETORY_TRAFFICKING; mean NES -0.0142; 87.0 (43.0 / 44.0). Open category evidence. Adjusted category P: 2.4098088085994045e-07; category significance: significant (****). Vesicle, endocytosis, exocytosis and sec… 87.0 (43.0 / 44.0) **** -0.0142 -2.38 0 2.38
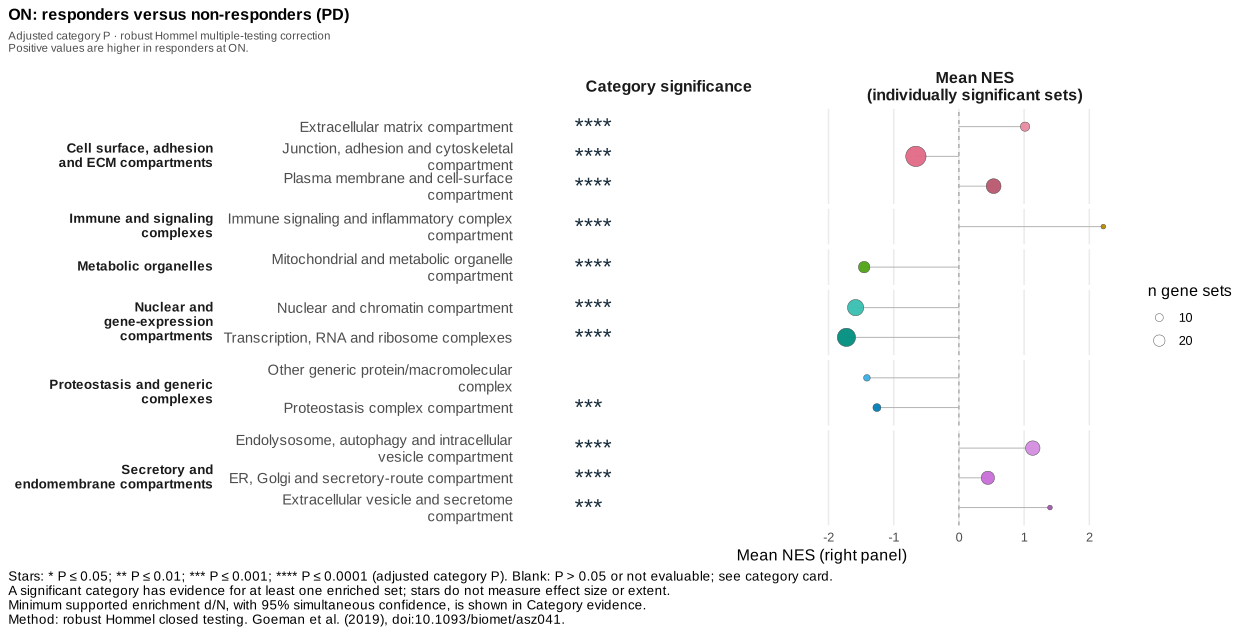
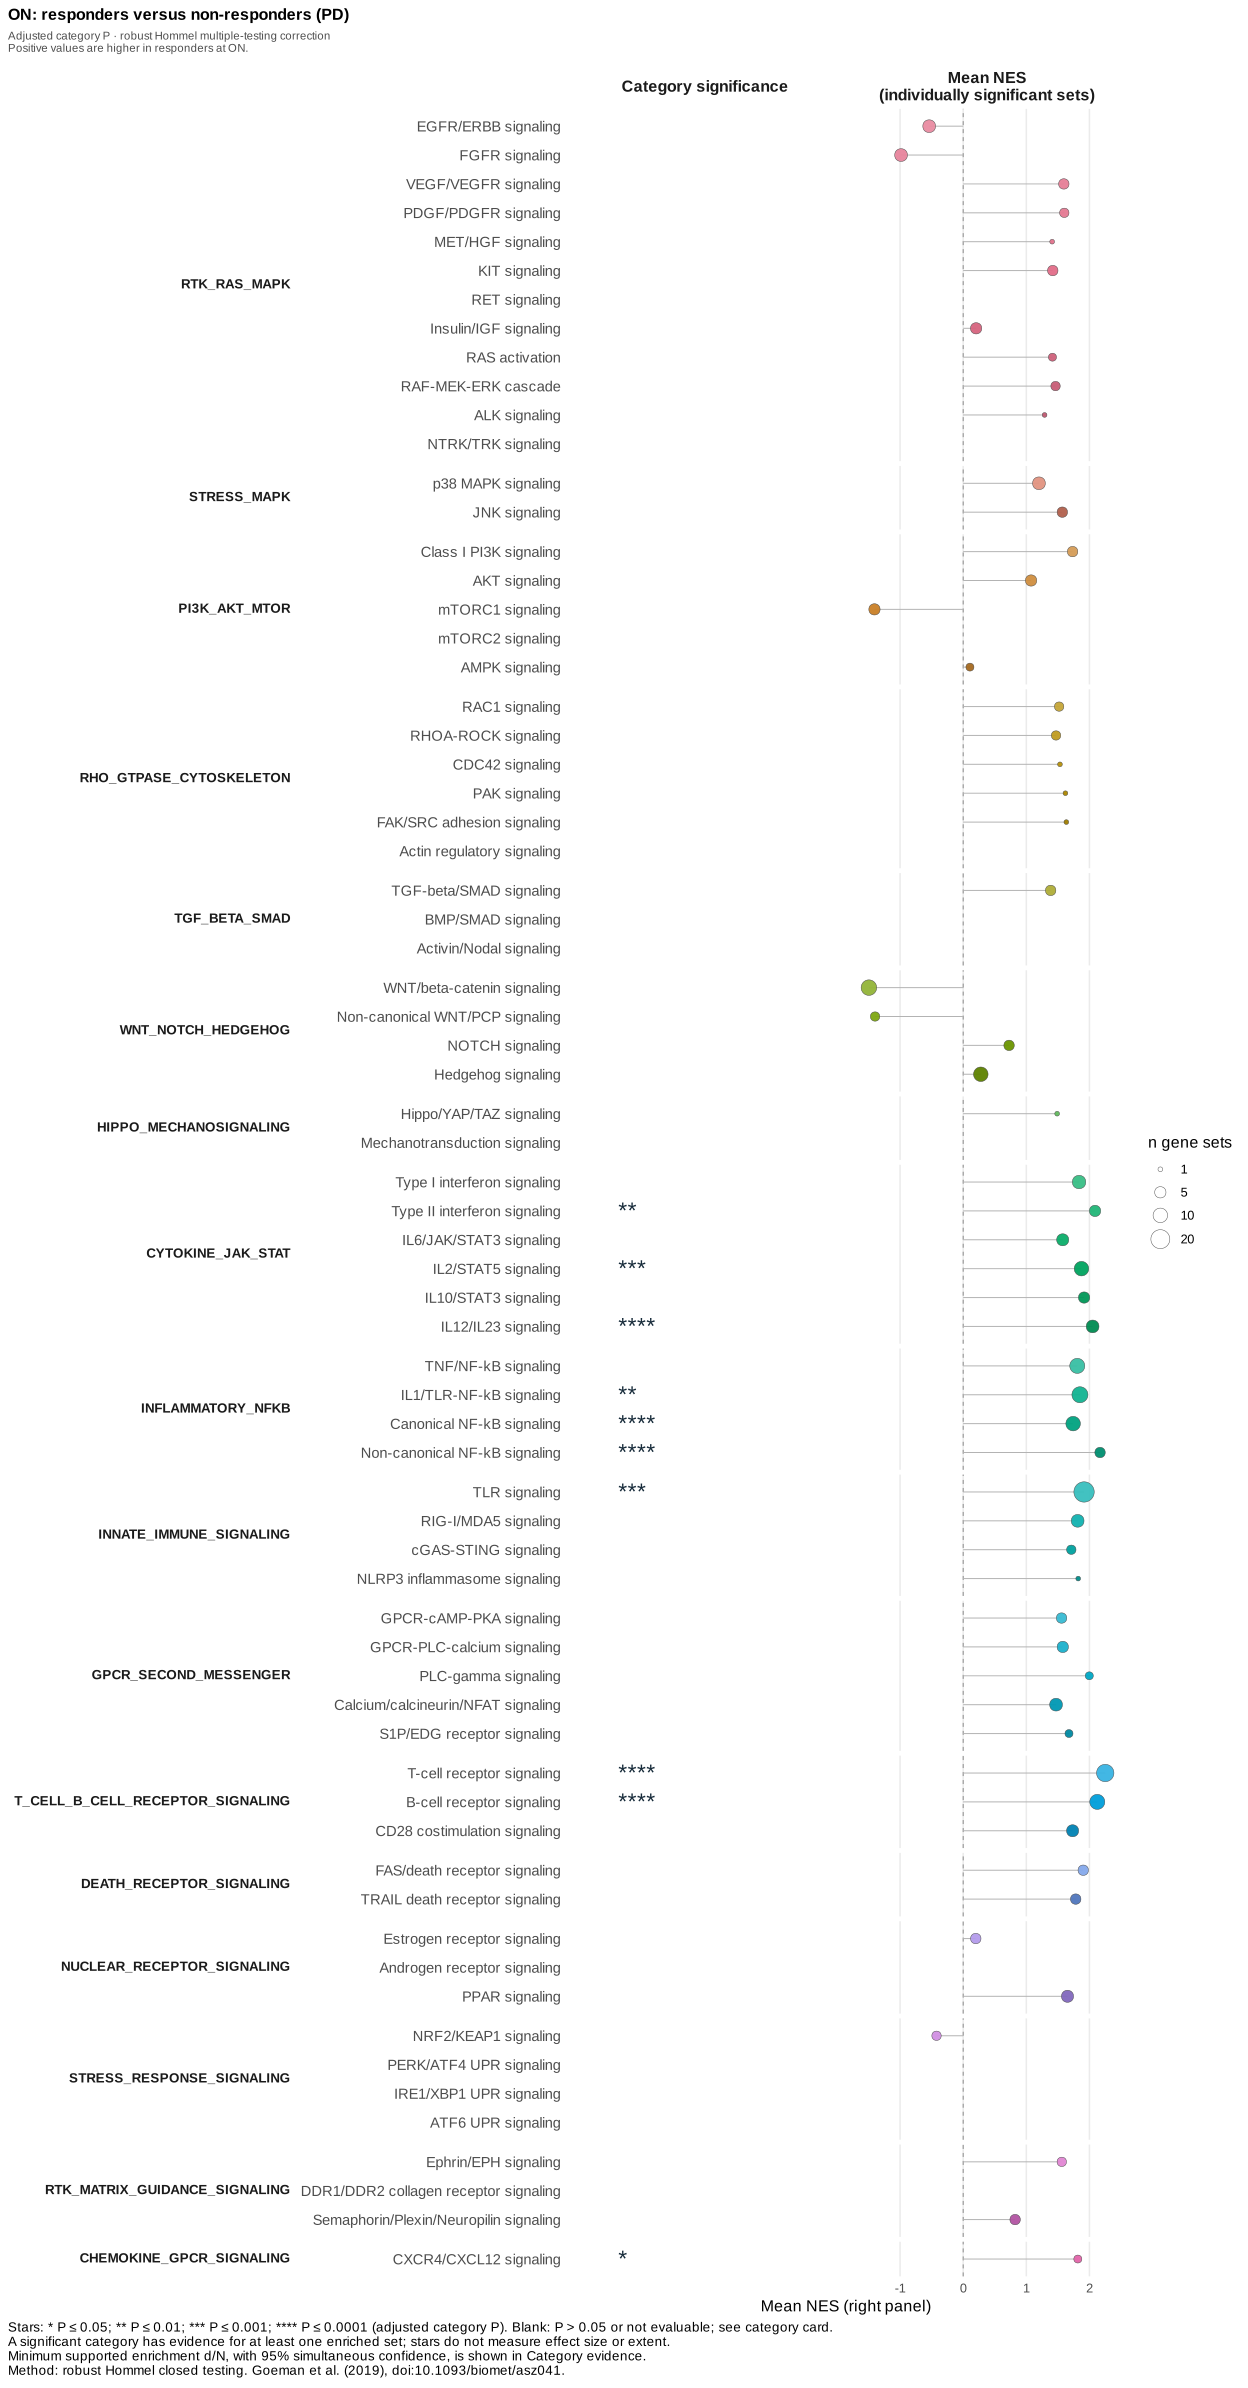
PATHWAYS · Riaz ON · mean NES and Hommel-adjusted category significance
On-treatment Riaz PATHWAYS. Points show descriptive category mean NES, size shows significant member sets, and stars show Hommel-adjusted category P. The preview shows only the top; open the full figure to inspect all categories.
Original image
PATHWAYS · Riaz ON · mean NES and Hommel-adjusted category significance

Comparing analyses

Compare two profiles

Examine how each category summary differs between two analyses. This is a descriptive comparison, not a new differential expression model.

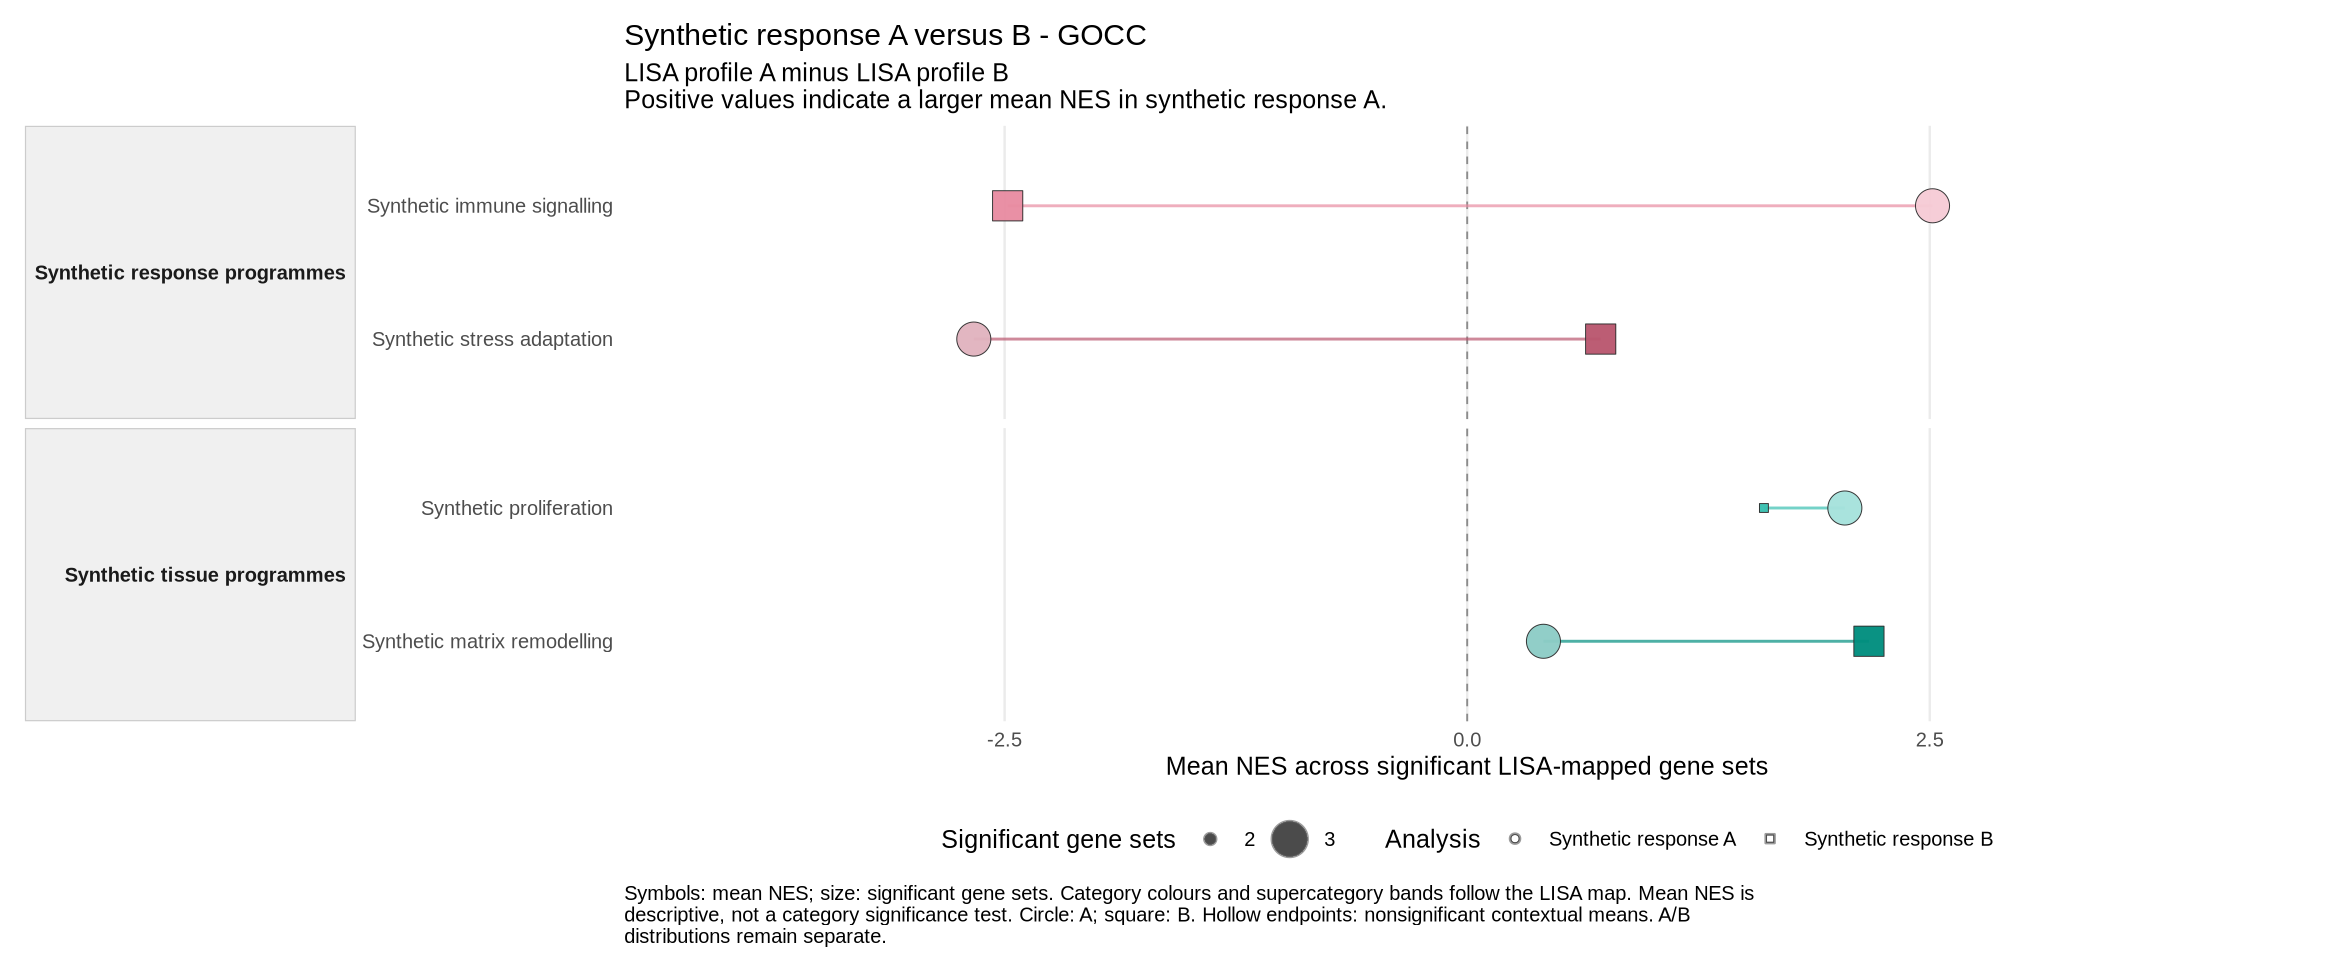
Comparison using synthetic data with circles for response A and squares for response B across four categories, joined row by row

Example with synthetic data

Compare mean NES between two analyses

Circles represent analysis A and squares represent analysis B. Each line connects the means of the same category for comparison. These are descriptive summaries, not category-level significance tests or treatment effects.

03 · Analysis examples

Applications in RNA-seq and proteomics

The tutorials use differential expression results from published studies to analyse enrichment and explore biological categories. The differential expression model is fitted before using lisaR.

RNA-seq · Riaz GSE91061

Paired melanoma biopsies

This example uses RNA-seq from paired melanoma biopsies collected before and during nivolumab treatment (anti-PD1). It explores differences between responders (CR/PR) and patients with progressive disease (PD).

Analyses included in the tutorial

Both STANDARD and FULL contain the PRE and ON differential expression analyses and one descriptive ON-minus-PRE profile comparison. FULL adds the applicable figures within the same report.

Figure shown: CR/PR minus PD during nivolumab treatment. Positive values correspond to responders. This descriptive profile does not establish a causal treatment effect.
Read the Riaz guide

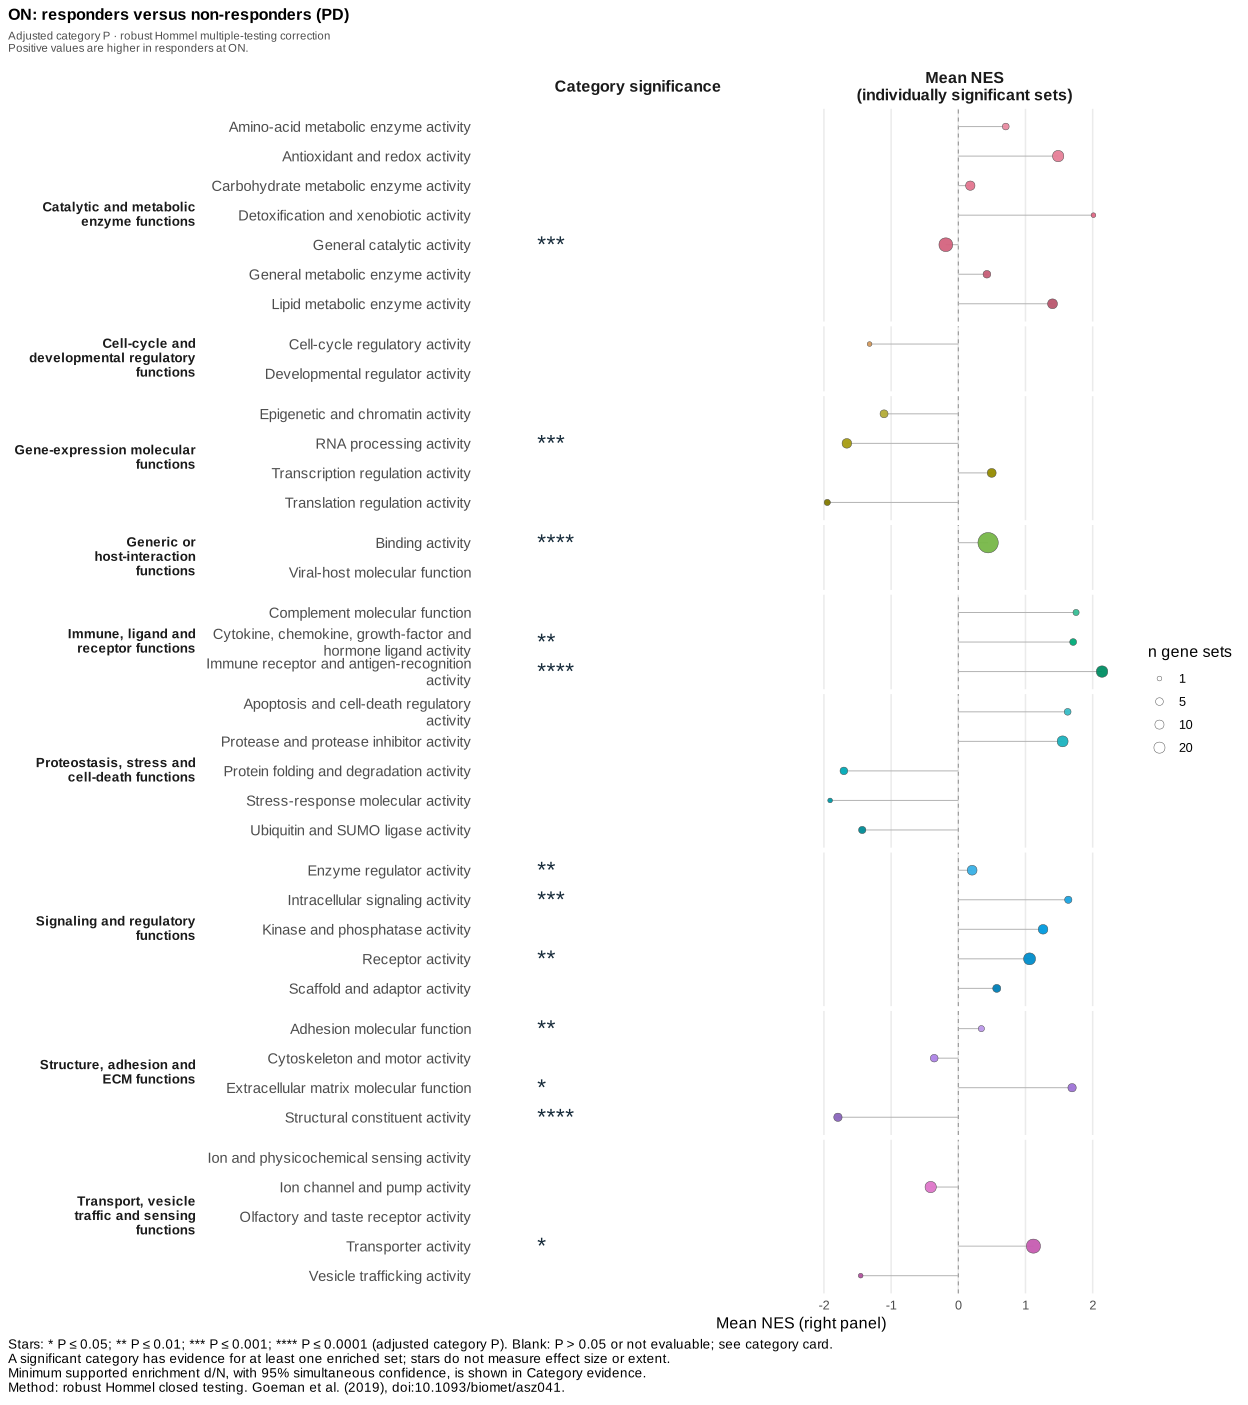
Riaz ON GOBP-C2 category overview: mean NES and Hommel-adjusted significance for responders minus PD
GOBP-C2 categories: position indicates descriptive mean NES, size indicates significant member sets, and stars show Hommel-adjusted category P.

Proteomics · CPTAC ccRCC

Paired renal tissue

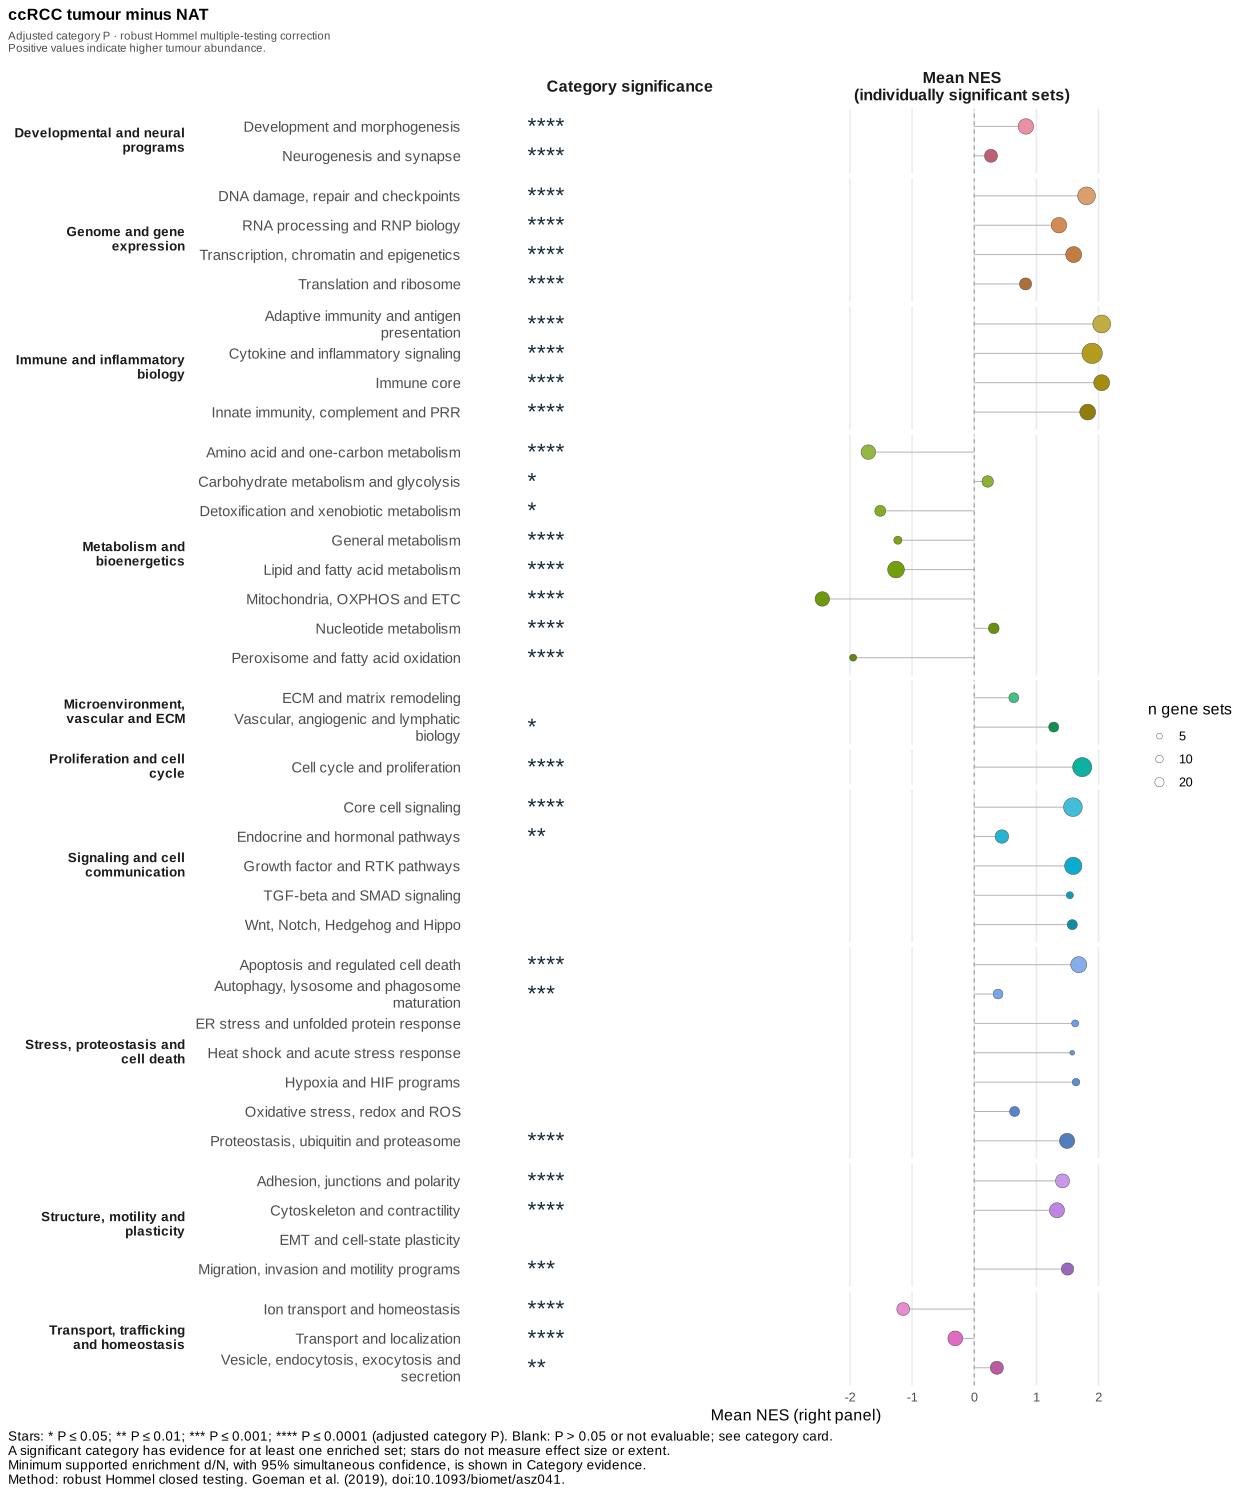
This example uses proteomics data from 80 matched sample pairs of clear cell renal cell carcinoma (ccRCC): tumour and adjacent non-tumour renal tissue. Analysis coverage depends on detected proteins, their mapping to genes and the applied filters.

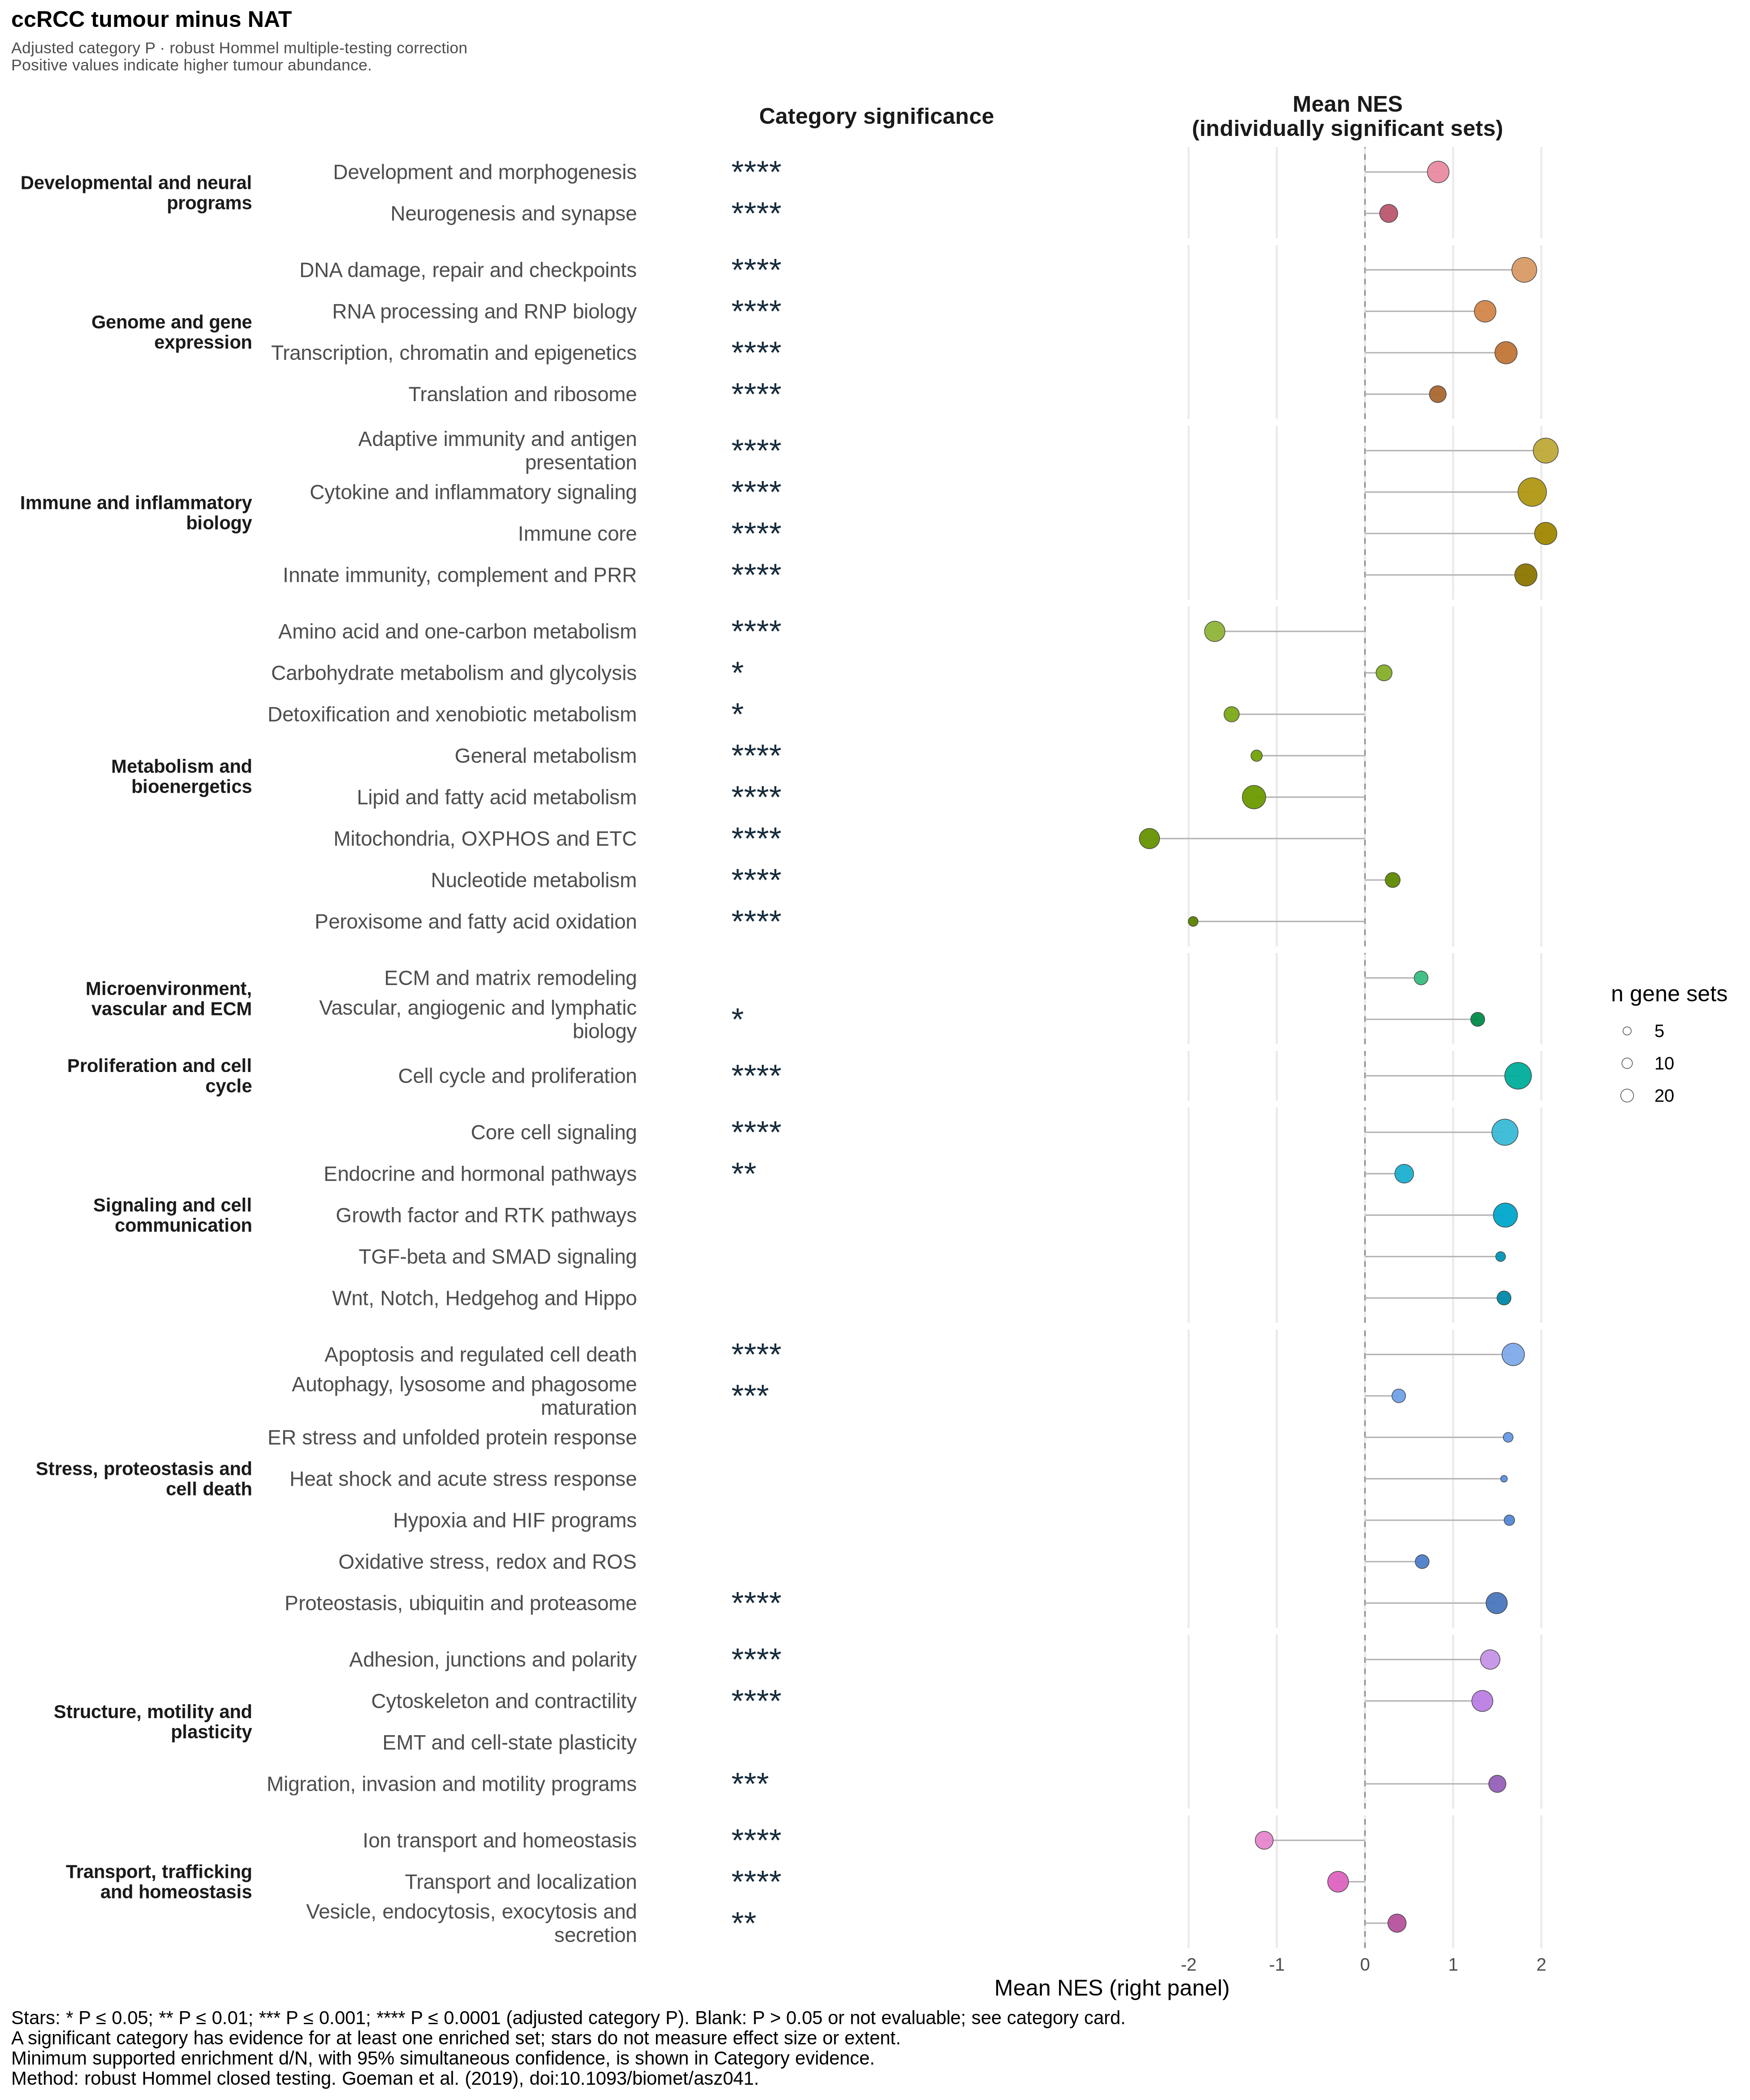
Comparison: tumour minus adjacent non-tumour tissue. Positive values indicate greater abundance in the tumour. Adjacent tissue is not from healthy donors.

Read the CPTAC guide

CPTAC GOBP-C2: mean NES and Hommel-adjusted category P for paired tumour minus adjacent tissue
Mean NES is descriptive; point size counts individually significant gene sets. Stars mark Hommel-adjusted category P (31 of 40 significant), not NES magnitude or direction.
PNG · SVG · PDF · Category results · Plotted data
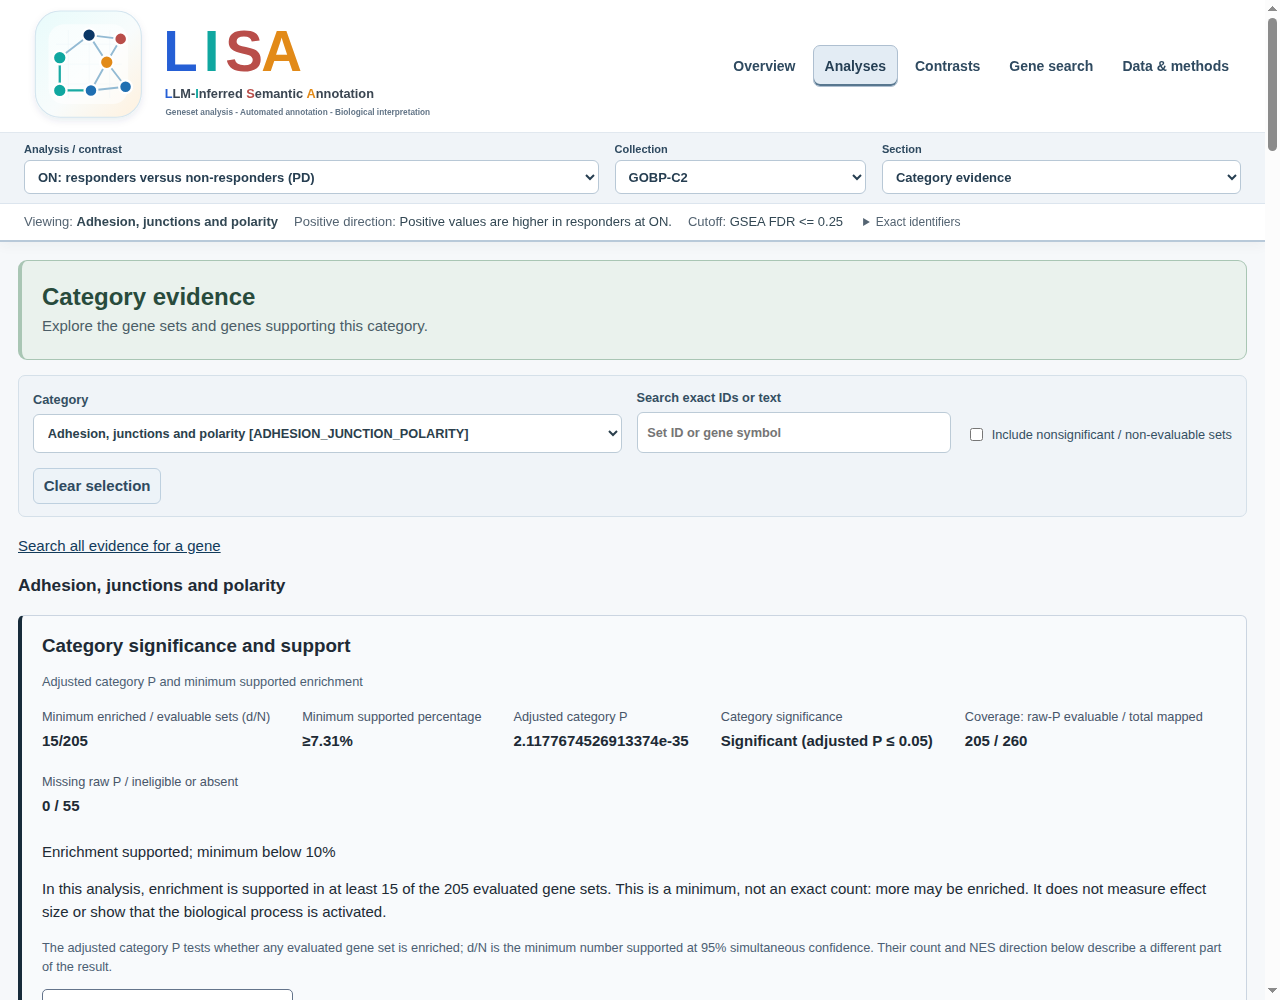
Validated Riaz ON report: analysis, GOBP-C2 and category selectors above the Hommel-adjusted significance and support card

Screenshot of a validated lisaR report

Select an analysis and a category

The Riaz ON/GOBP-C2 view keeps analysis, collection and category visible. Its card reports Hommel-adjusted category P and minimum supported enrichment (d/N); inspect the member sets, genes and available downloads below.

lisaR outputs

Figures and tables you can produce

The report brings together your analysis results and generated figures. You can create further figures from saved results using R or Shiny. Available outputs depend on your input data and selected options.

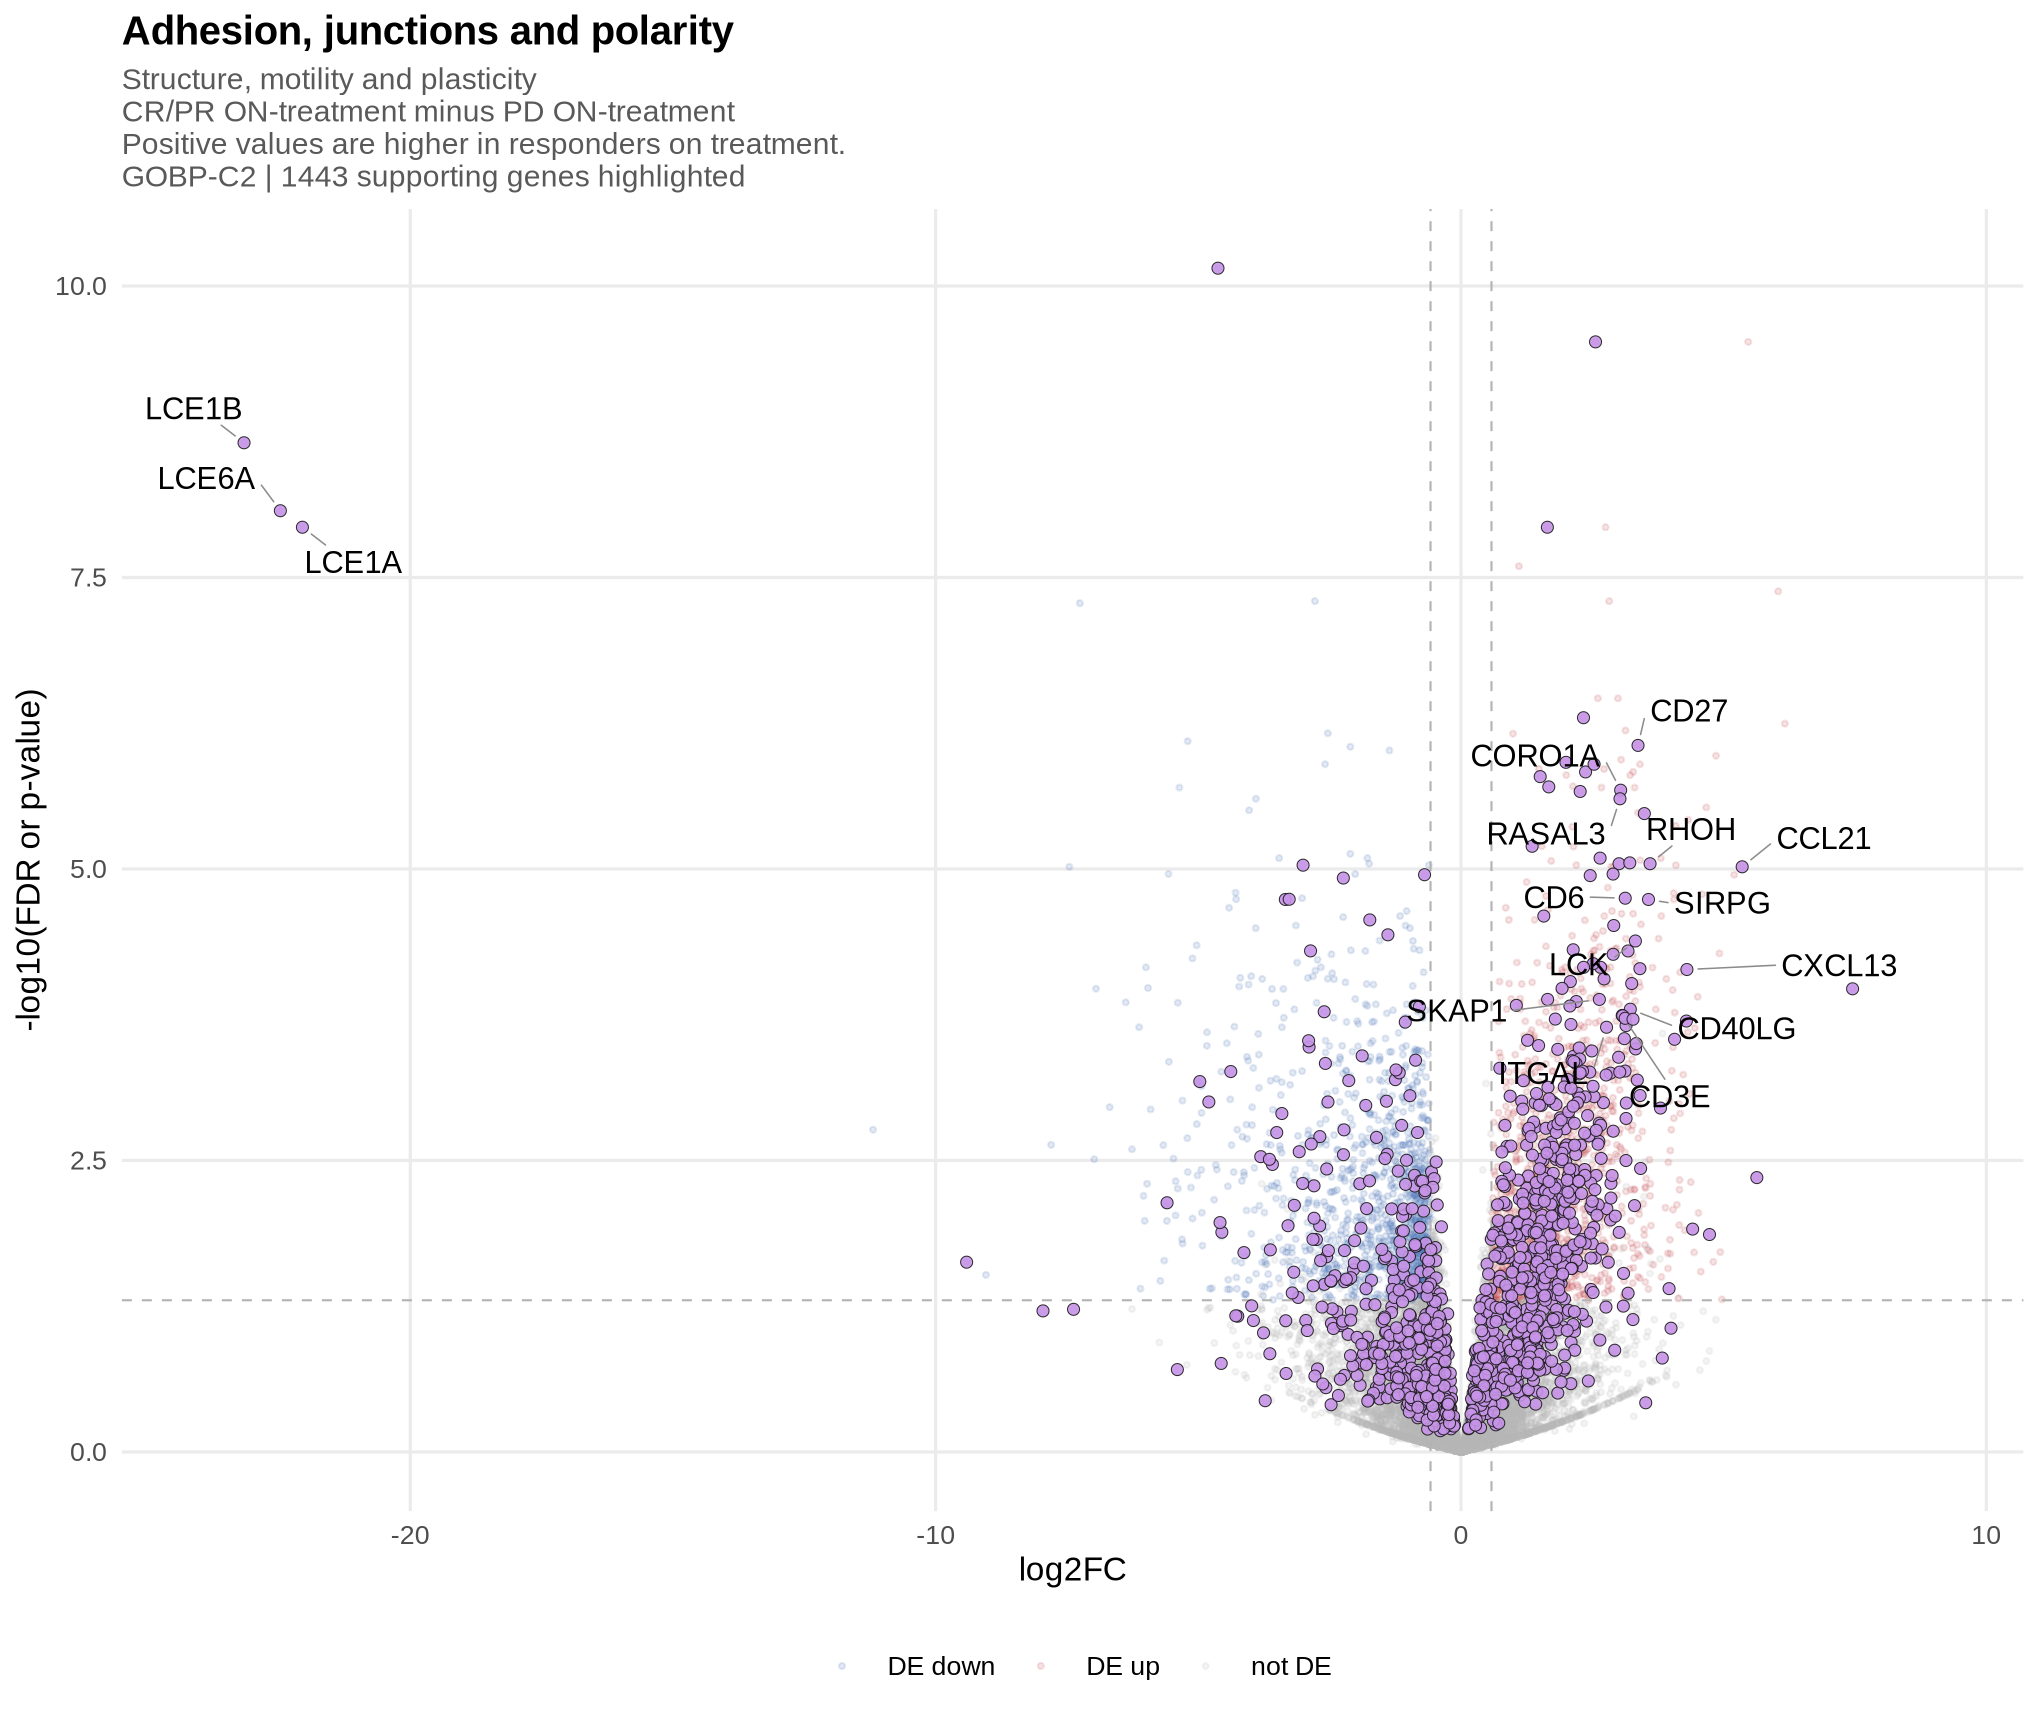
Volcano plots: Riaz, GOBP-C2, Adhesion, junctions and polarity

Volcano plots

Locate the genes of a category within the differential expression results.

Riaz · GOBP-C2 · CR/PR − PD · on treatment.

View full figure · Data (TSV)
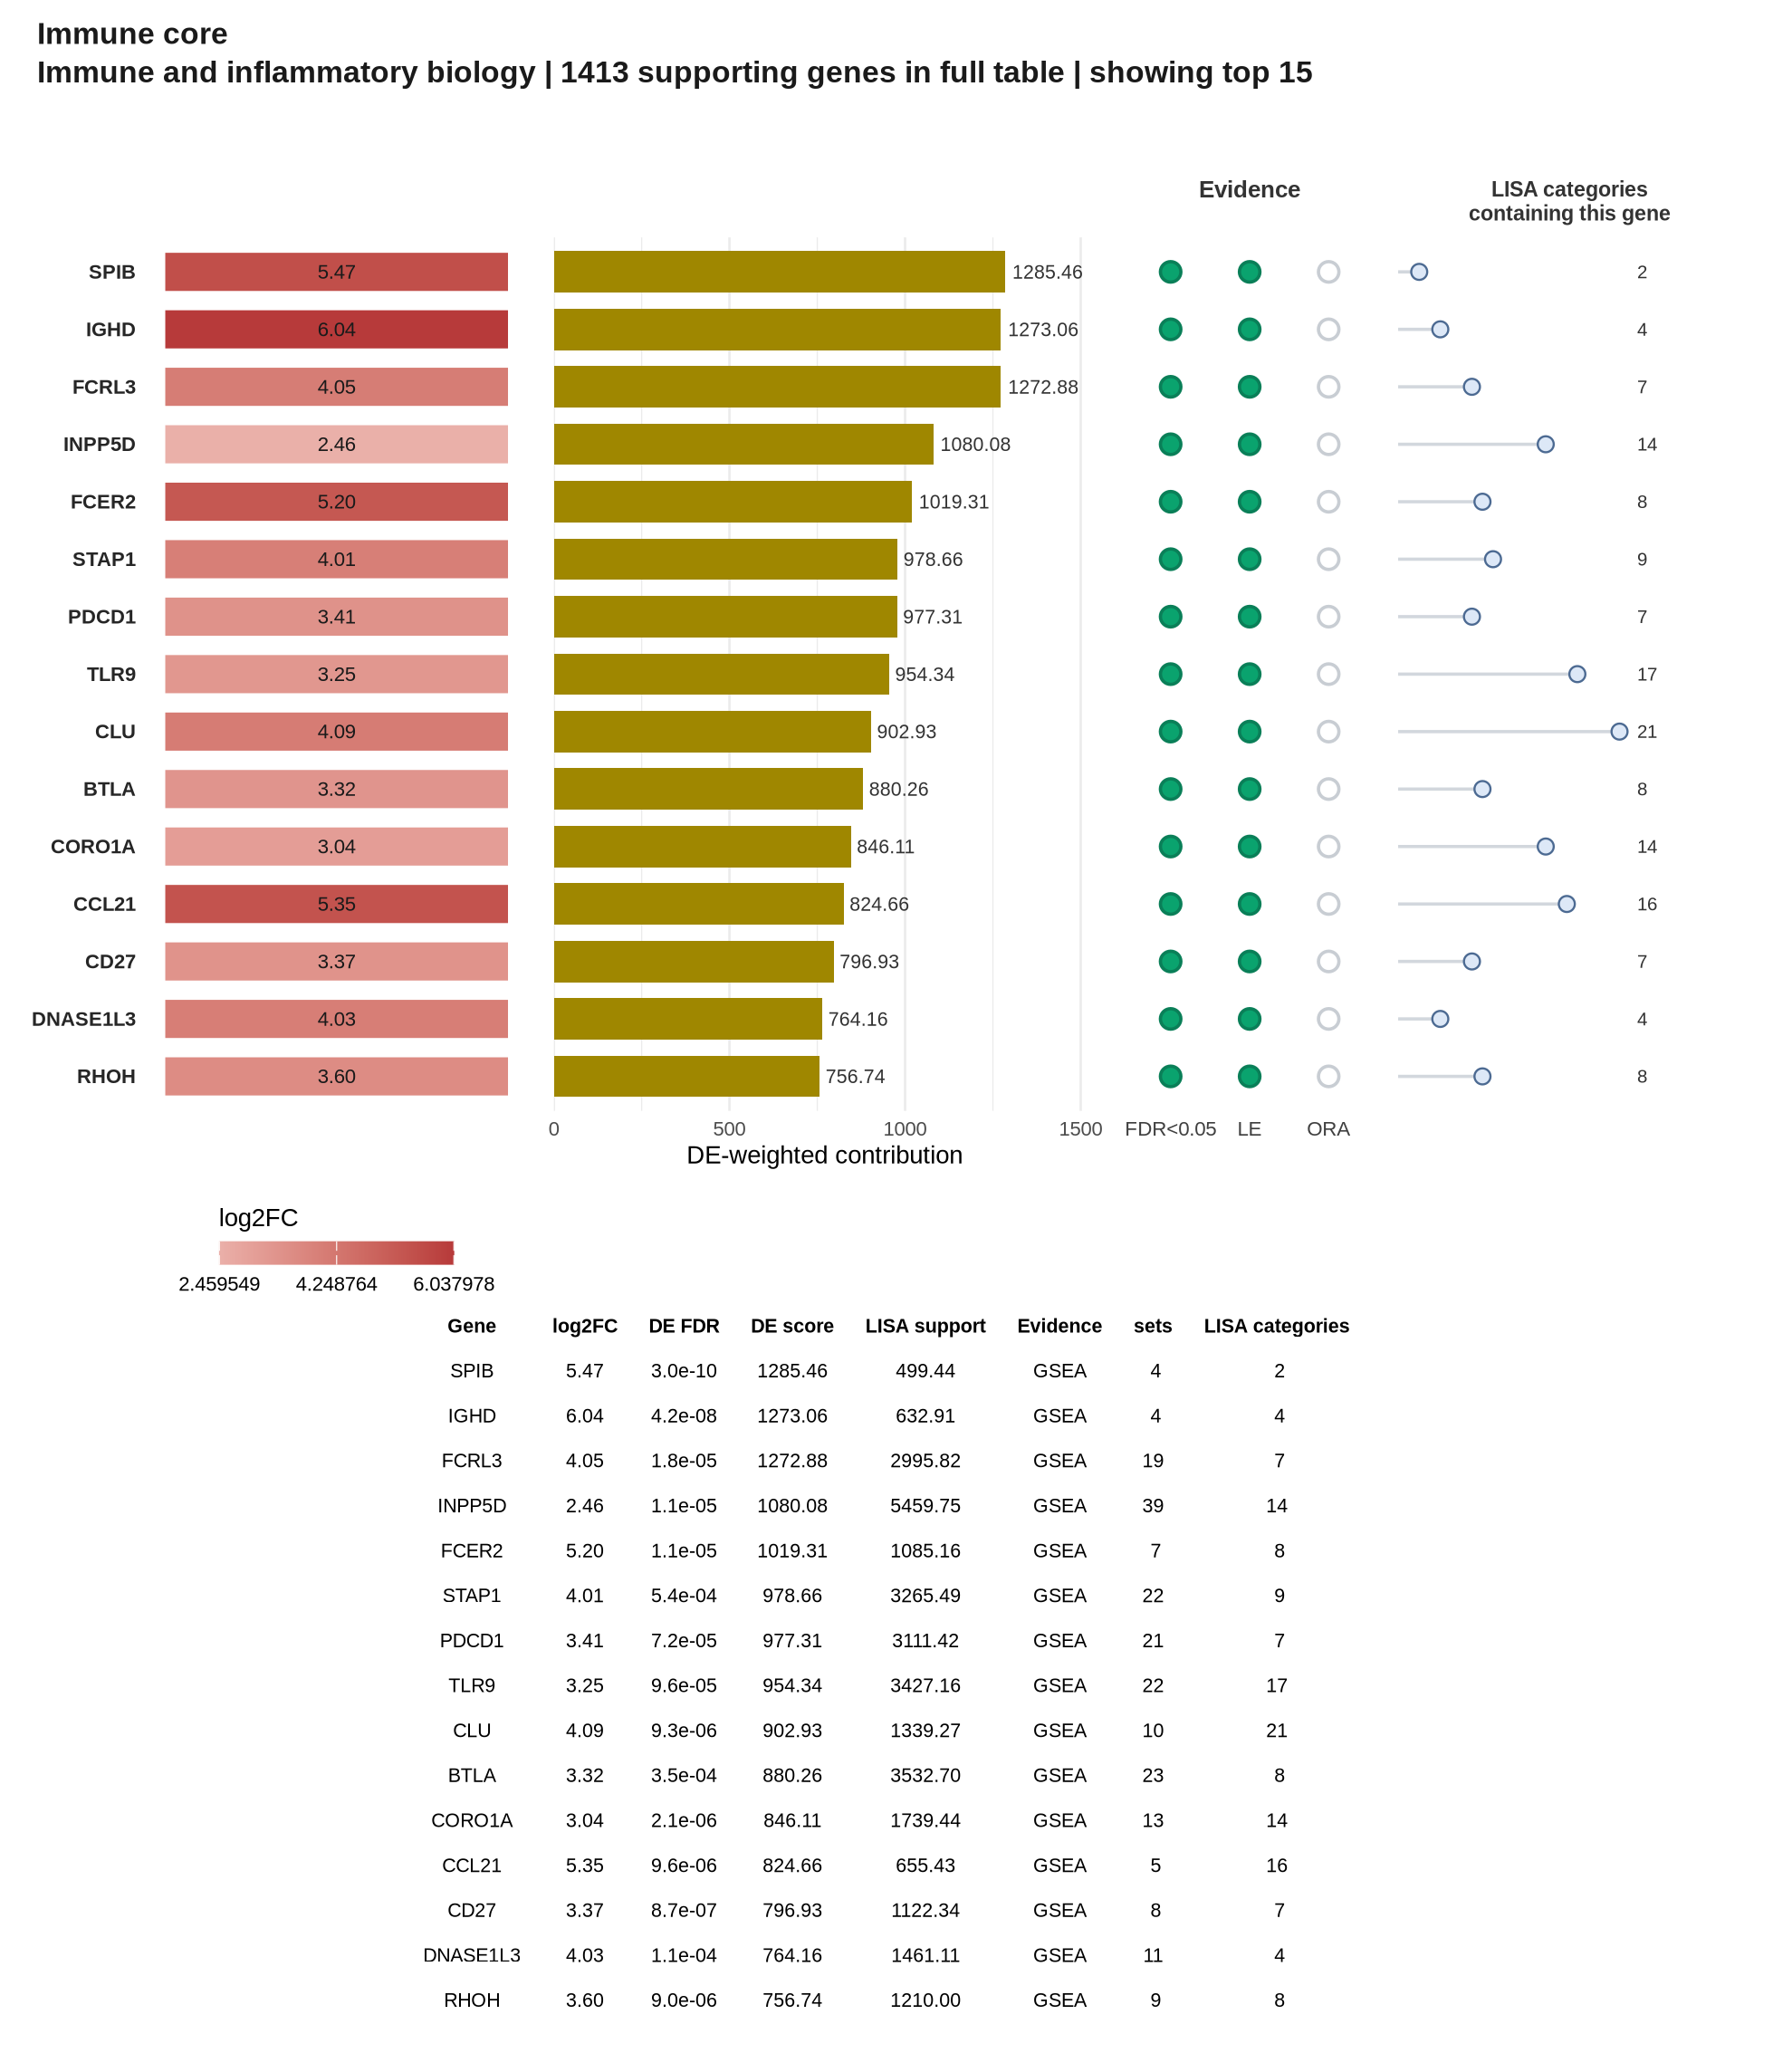
Gene cards: Riaz, GOBP-C2, Immune core

Gene cards

Bring together the genes of a LISA category, their expression changes and gene set associations. This preview shows part of the Immune core gene card.

Riaz · GOBP-C2 · CR/PR − PD · on treatment.

View full figure · Data (TSV)

LISA plots

Summaries by LISA category: mean NES, distribution and number of significant gene sets.

View the category plot

Profile comparisons

Figures comparing two analyses by LISA category. These are descriptive comparisons, not a new differential expression analysis.

View a comparison

KEGG maps

Pathway maps coloured by gene-level differential expression results. These require a local KEGG map resource, separate from gene set enrichment.

Read the requirements

Tables and files for further work. Inspect gene set and gene tables, and export figures as PNG, SVG or PDF depending on the product and selected options. Supporting source data and generation recipes are also saved for products that provide them. Report guide.

04 · Guides

Guides to using lisaR

Start by installing lisaR, then run the Riaz ON example. Continue with your own differential expression results and learn to read the report. The guided path uses run_lisa() without a configuration file; PNG and SVG figures, source tables and figure recipes are included by default.

Start with the four-step path below. The detailed guide bodies are in British English; the paths on this page remain available in both website languages.

Basic guided path

  1. 1 · Install lisaRSet up lisaR on your computer.
  2. 2 · Riaz ON quick startFollow one worked on-treatment example.
  3. 3 · Use your own DE resultsPrepare and analyse your ranked differential-expression results.
  4. 4 · Read your reportInspect saved results, figures and tables.
Advanced

Reference

More English guides and existing links

Code and publications

Availability

Bioconductor

The Bioconductor package link is pending.

Link pending