CPTAC ccRCC: paired global proteomics
This example asks which programmes are enriched in clear cell renal
cell carcinoma (ccRCC) relative to adjacent renal tissue. It starts from
a frozen, paired global-proteomic differential-abundance table for
80 matched pairs: one tumour and one adjacent
non-tumoral renal-tissue sample per patient, 160 samples in total. NAT
means adjacent non-tumour tissue here. It does not mean healthy donor
kidney.
The source study is Clark DJ, Dhanasekaran SM, Petralia F, et
al. Integrated Proteogenomic Characterization of Clear Cell Renal
Cell Carcinoma. Cell 2019;179:964-983, CPTAC ccRCC (PDC000127). The
reviewed example bundle contains derived inputs and audit records, not
the original abundance matrix.
Know what was prepared upstream

Input scope of the prepared CPTAC example. Protein-to-gene mapping,
filtering and paired modelling take place upstream of lisaR.
The supplied primary table has 6,482 usable, unique gene-symbol rows
for the 80-pair comparison. Its declared effect is
tumor_minus_nat, so a positive value means higher tumour
abundance. The ranking column is the moderated limma t from
the upstream paired model. p_value and
fdr_bh_all_genes remain in the table. lisaR uses the full
ranked table and does not refit limma or pre-filter genes by
significance for this route.
Protein measurements were mapped to gene identifiers and filtered
before this input was exported. The useful coverage for this example is
therefore the number of usable mapped gene rows, not a count of all
originally measured protein features. The frozen input audit records
zero duplicate Entrez IDs, zero missing Entrez IDs and zero non-finite
values in the required numeric columns. It does not establish the total
number of protein features before mapping, how many-to-one mappings were
resolved or how many features were discarded at each filter. A mapping
percentage or protein-level coverage claim cannot be recovered from
6,482 gene rows alone.
The global proteomic profile configures warnings below
500 usable features and below 1,500 usable features. These are
operational warning thresholds, not validated scientific minima. A
targeted panel has a limited feature universe and needs its own coverage
assessment; it is not represented by this global-proteomic example.
Tumour tissue and adjacent tissue also differ in cellular composition,
which this prepared differential-abundance table does not resolve.
Use a short writable project root. The examples below use
D:/lisa on Windows; change the drive if needed. Avoid
nesting the project under several long folder names. Preparation creates
study.yml, short inputs under data/ and a
provenance/path_map.tsv linking them to their original
names and hashes. Results go to out/. Scientific comparison
names and directions are unchanged.
1. Obtain the reviewed bundle
Install lisaR first with Installation, then make the external
membership resource available through Resources and provenance.
Obtain the reviewed input bundle in a new destination:
library(lisaR)
root <- if (.Platform$OS.type == "windows") "D:/lisa" else "~/lisa"
root <- path.expand(root)
dir.create(file.path(root, "bundles"), recursive = TRUE, showWarnings = FALSE)

bundle <- install_lisa_example_bundle(
  "cptac-ccrcc",
  destination = file.path(root, "bundles", "cptac")
)
bundle$next_command
The default source is a versioned public release in
DBM-OlmedaLab/lisaR-example-data. The installer verifies
the pinned archive and the six-file member manifest before promoting it.
A verified cached archive can be reused offline. The bundle contains the
primary table and five audit files, but acquiring it does not run
lisaR.
bundle$next_command is a complete POSIX shell command
with prepare-only mode enabled. To prepare from R or RStudio using the
current R installation:
2. Create and check the prepared project
project <- normalizePath(file.path(root, "cptac"),
                         winslash = "/", mustWork = FALSE)
Sys.setenv(
  LISAR_CPTAC_CCRCC_BUNDLE = bundle$bundle,
  LISAR_CPTAC_CCRCC_PROJECT_DIR = project,
  LISAR_CPTAC_CCRCC_PREPARE_ONLY = "1"
)
prepare_script <- system.file("examples", "cptac-ccrcc",
  "prepare_and_run_cptac_ccrcc.R", package = "lisaR")
status <- system2(file.path(R.home("bin"), "Rscript"),
                  c("--vanilla", shQuote(prepare_script)))
Sys.unsetenv("LISAR_CPTAC_CCRCC_PREPARE_ONLY")
stopifnot(status == 0L)
Preparation verifies and copies the inputs, resolves resources,
validates and plans the project, then reports
CPTAC_CCRCC_LOCAL_ROUTE=PREPARE_ONLY_PASS. It performs no
new differential-abundance fit and does not call
run_lisa(). The promoted directory is an execution-ready
prepared project, not a completed scientific result.
3. Inspect the configuration and its output plan
config <- file.path(project, "study.yml")
study <- yaml::read_yaml(config)
print(study$pipeline)
print(data.frame(
  analysis = study$single_de[[1]]$analysis_id,
  comparison = study$single_de[[1]]$comparison,
  positive_direction = study$single_de[[1]]$positive_direction,
  rank_column = study$single_de[[1]]$rank_col
))
validation <- validate_lisa_config(config, check_files = TRUE)
stopifnot(validation$execution_ready)
output_plan <- plan_lisa_outputs(config)
print(output_plan$summary)
This inspection and plan_lisa_outputs() describe the
intended products. They do not execute GSEA. Check that the analysis is
cptac_ccrcc_tumor_minus_nat, the effect direction is tumour
minus NAT and the ranking column is t before
proceeding.
4. Run, verify and recognise the result
result <- run_lisa(config)
check <- verify_lisa_run(result$output_dir)
stopifnot(identical(result$gate, "PASS"), identical(check$gate, "PASS"))
print(result$output_dir)
browseURL(file.path(result$output_dir, "report_index.html"))
The generated configuration has one DE analysis,
cptac_ccrcc_tumor_minus_nat, and no LISA profile
contrast in this example. It uses
global proteomic, one worker, the four semantic collections
and the resource identities lisa_dictionary_core@1.0.0,
msigdb_term2gene@2026.1 and
lisa_category_map@1.0.0. Hallmarks, ORA and native KEGG
maps are disabled. This is a choice for the example, not a restriction
on proteomic studies in lisaR.
A successful run is written to project/out. Verification
must report gate PASS. In the report, positive NES follows
the prepared tumour-minus-NAT ranking. No responder grouping,
healthy-donor comparison or protein-level model has been added by
lisaR.
STANDARD provides category plots and linked gene-set/gene evidence.
The report guide shows how to add
selected presentation products to a completed run without repeating
enrichment.

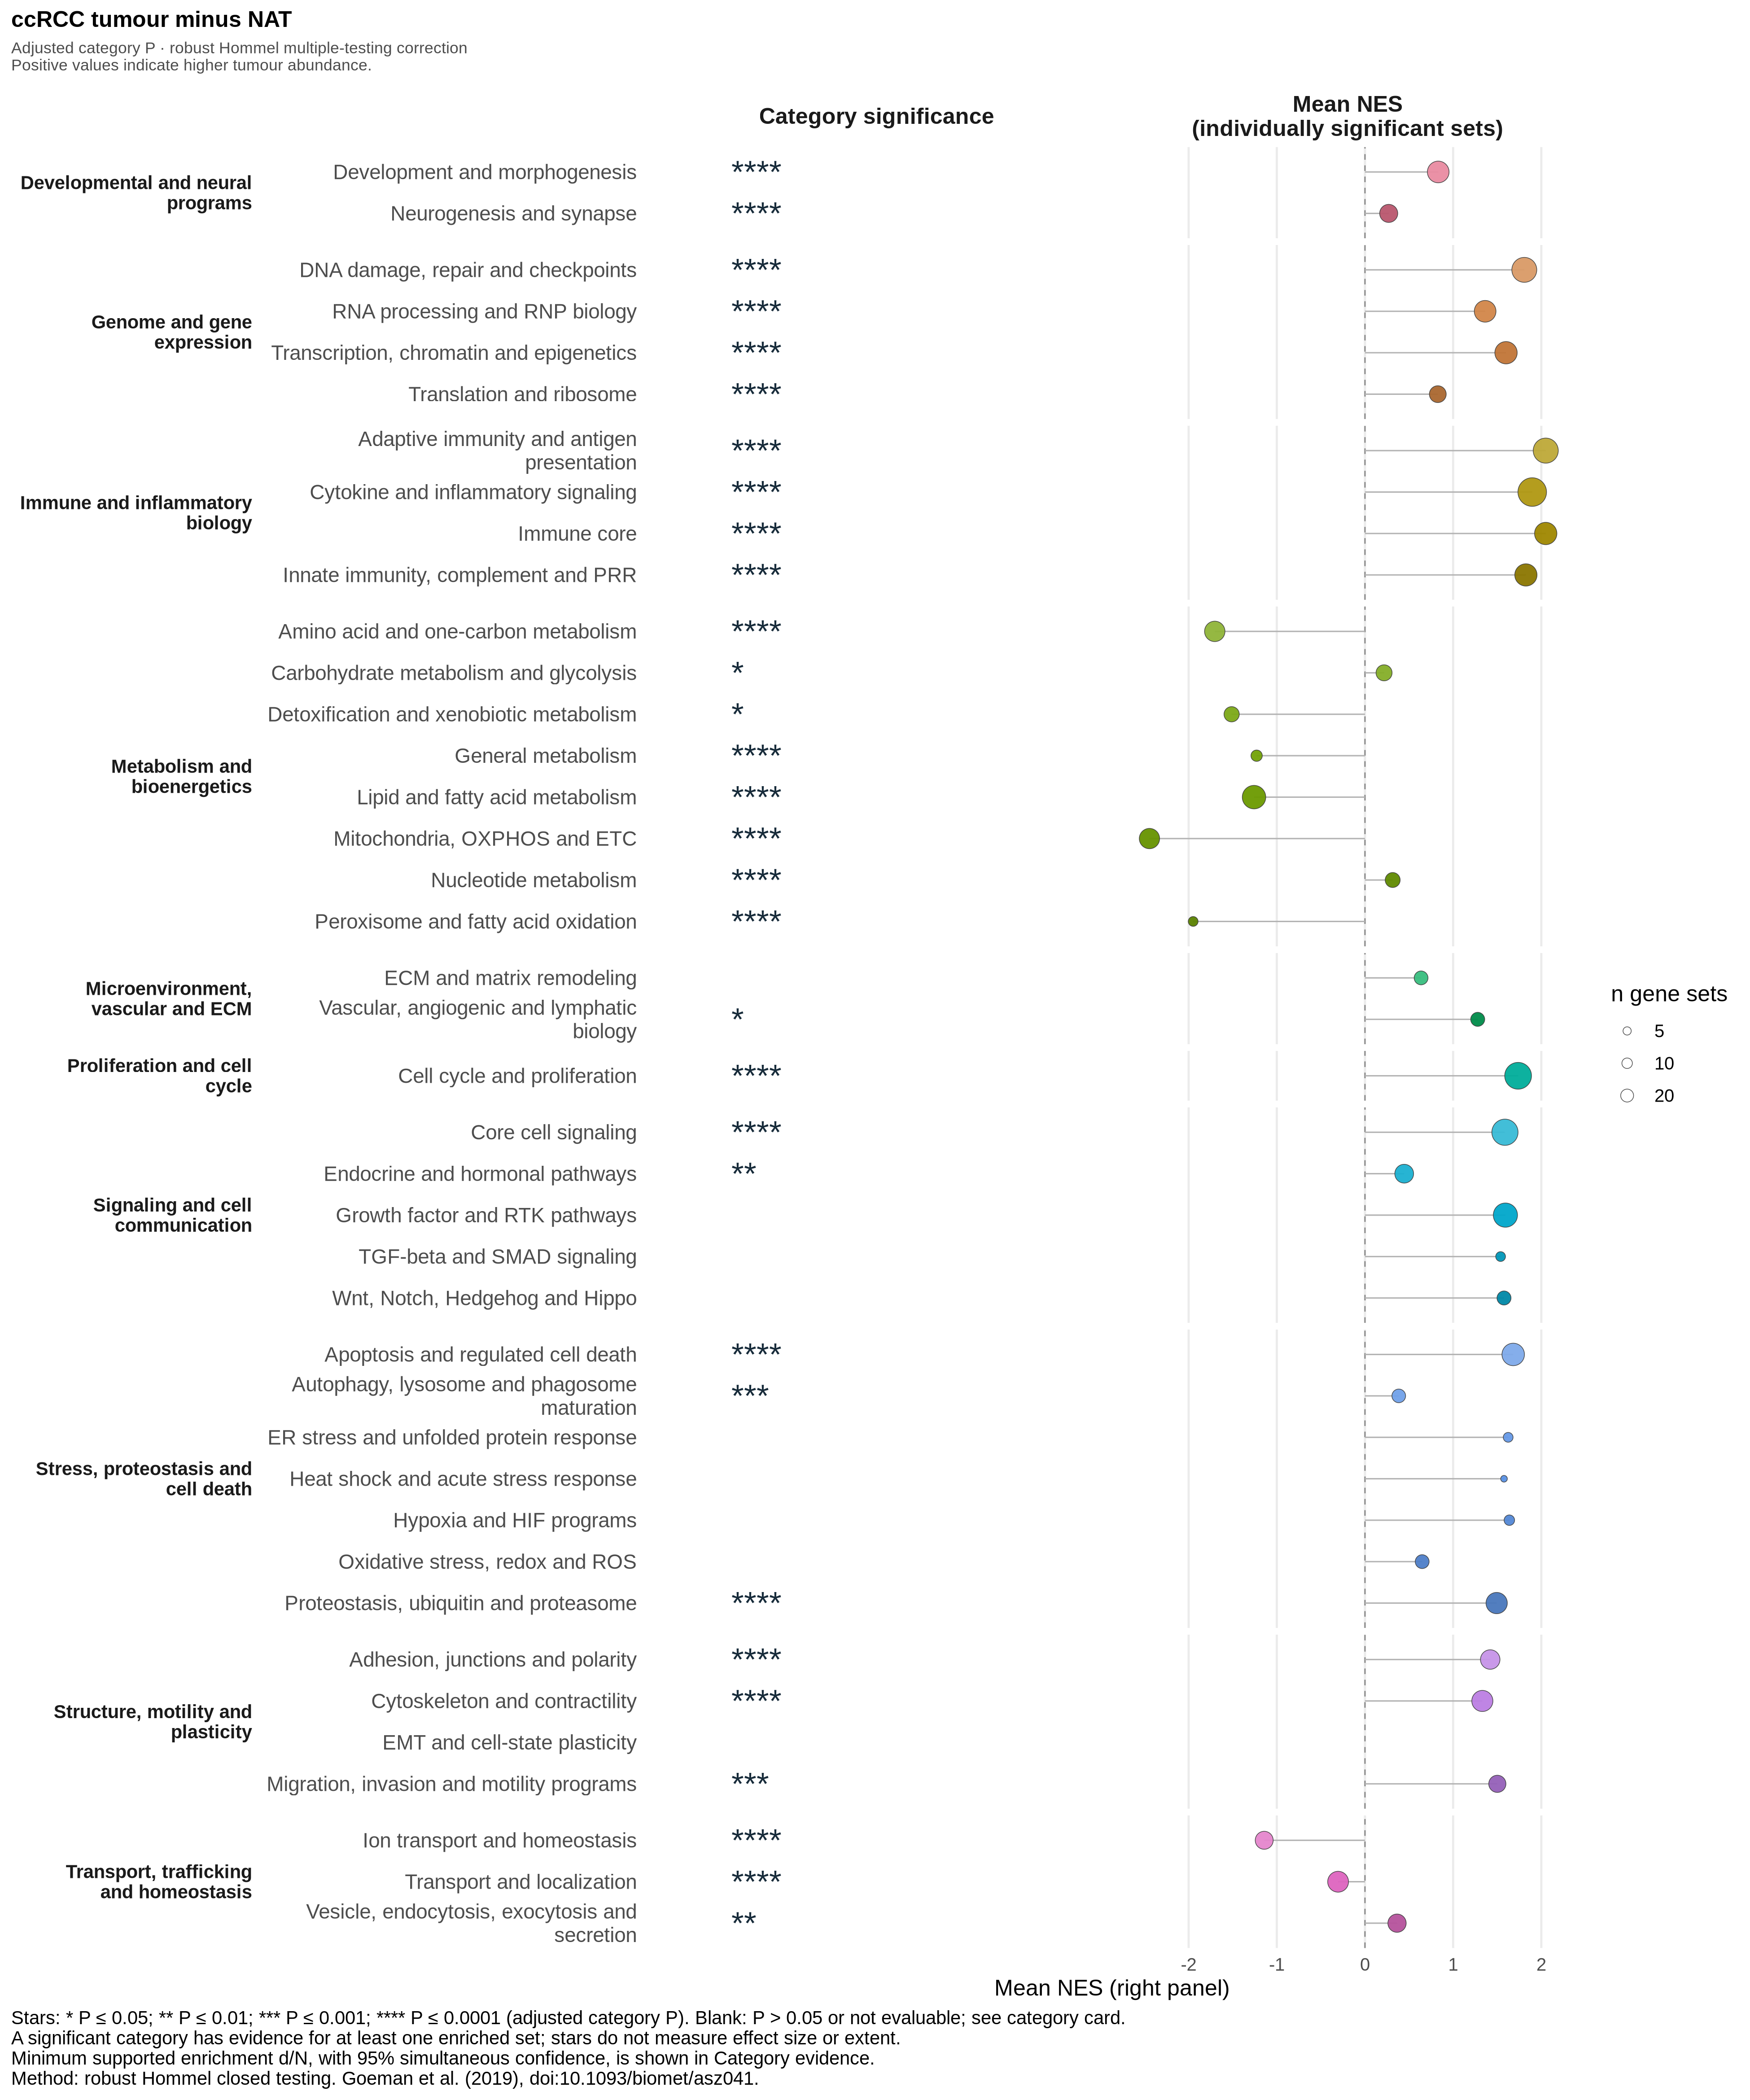
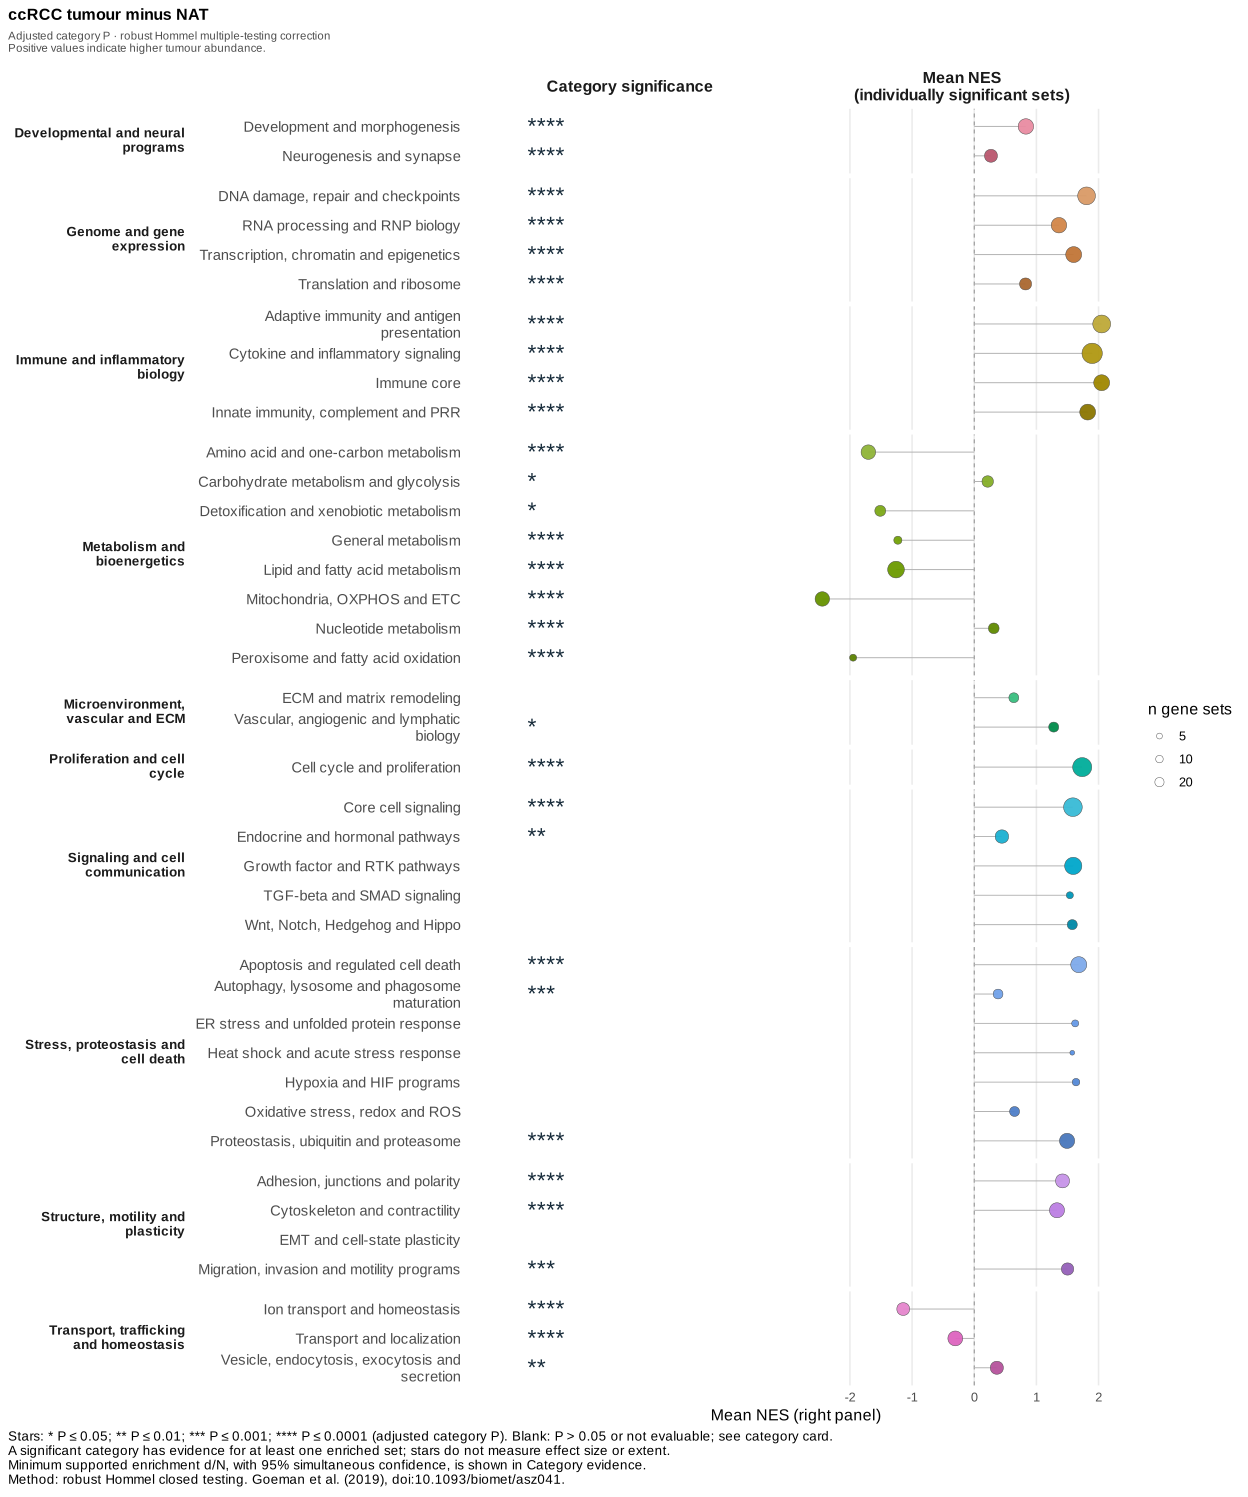
Each point shows descriptive mean NES of individually significant unique member gene sets (GSEA adjusted P ≤ 0.25); size is their count. Positive NES follows tumour minus adjacent tissue. Stars show Hommel-adjusted category P (one to four stars at ≤ 0.05, 0.01, 0.001 and 0.0001). Category significance is not inferred from mean NES or point size; blank means P > 0.05 or not evaluable. The 40 GOBP-C2 categories include 31 significant categories in this saved 80-pair example.
Full-size PNG, SVG, PDF, category results, plotted source and figure settings.
Optional upstream reconstruction
The prepared example bundle includes the DE table, not an executable
reconstruction from raw mass spectra. A defensible upstream rebuild
starts from an authorised processed abundance matrix and sample
annotations from CPTAC/PDC.
Reproduce the 80-pair selection, specify the paired limma design and
preserve the protein-to-gene mapping, collision handling, filtering and
missing-value decisions before exporting a complete ranked table. The
supplied audit files identify the prepared input, but do not replace
those source materials. This separate task is not run by the example
preparer, and the guide does not claim a route from raw mass
spectra.
What the five audit files document
The prepared project carries the primary DE table with five audit
records: the matched-pair sample receipt, primary QC, data-quality
summary, input provenance and the 80-pair list. They establish the input
contract for this example. They do not substitute for access conditions,
clinical context, sample processing information or an independent
reanalysis of the source proteomics.
For another proteomic study, preserve the upstream mapping record,
the number of measured features, the number retained after mapping and
filtering, the duplicate policy, and missing-value handling with the
prepared DE result. The Preparing DE
inputs guide describes the general prepared-input contract.